Archive for the ‘Health-Checks’ Category
eDB360 includes now an optional staging repository
eDB360 has always worked under the premise “no installation required”, and still is the case today – it is part of its fundamental essence: give me a 360-degree view of my Oracle database with no installation whatsoever. With that in mind, this free tool helps sites that have gone to the cloud, as well as those with “on-premises” databases; and in both cases not installing anything certainly expedites diagnostics collections. With eDB360, you simply connect to SQL*Plus with an account that can select from the catalog, execute then a set of scripts behind eDB360 and bingo!, you get to understand what is going on with your database just by navigating the html output. With such functionality, we can remotely diagnose a database, and even elaborate on the full health-check of it. After all, that is how we successfully use it every day!, saving us hundreds of hours of metadata gathering and cross-reference analysis.
Starting with release v1706, eDB360 also supports an optional staging repository of the 26 AWR views listed below. Why? the answer is simple: improved performance! This can be quite significant on large databases with hundreds of active sessions, with frequent snapshots, or with a long history on AWR. We have seen cases where years of data are “stuck” on AWR, specially in older releases of the database. Of course cleaning up the outdated AWR history (and corresponding statistics) is highly recommended, but in the meantime trying to execute edb360 on such databases may lead to long execution hours and frustration, taking sometimes days for what should take only a few hours.
- dba_hist_active_sess_history
- dba_hist_database_instance
- dba_hist_event_histogram
- dba_hist_ic_client_stats
- dba_hist_ic_device_stats
- dba_hist_interconnect_pings
- dba_hist_memory_resize_ops
- dba_hist_memory_target_advice
- dba_hist_osstat
- dba_hist_parameter
- dba_hist_pgastat
- dba_hist_resource_limit
- dba_hist_service_name
- dba_hist_sga
- dba_hist_sgastat
- dba_hist_sql_plan
- dba_hist_sqlstat
- dba_hist_sqltext
- dba_hist_sys_time_model
- dba_hist_sysmetric_history
- dba_hist_sysmetric_summary
- dba_hist_sysstat
- dba_hist_system_event
- dba_hist_tbspc_space_usage
- dba_hist_wr_control
- dba_hist_snapshot
Thus, if you are contemplating executing eDB360 on a large database, and provided pre-check script edb360-master/sql/awr_ash_pre_check.sql shows that eDB360 might take over 24 hours, then while you clean up your AWR repository you can use the eDB360 staging repository as a workaround to speedup eDB360 execution. The use of this optional staging repository is very simple, just look inside the edb360-master/repo directory for instructions. And as always, shoot me an email or comment here if there were any questions.
Discovering if a System level Parameter has changed its value (and when it happened)
Quite often I learn of a system where “nobody changed anything” and suddenly the system is experiencing some strange behavior. Then after diligent investigation it turns out someone changed a little parameter at the System level, but somehow disregarded mentioning it since he/she thought it had no connection to the unexpected behavior. As we all know, System parameters are big knobs that we don’t change lightly, still we often see “unknown” changes like the one described.
Script below produces a list of changes to System parameter values, indicating when a parameter was changed and from which value into which value. It does not filter out cache re-sizing operations, or resource manager plan changes. Both would be easy to exclude, but I’d rather see those global changes listed as well.
Note: This script below should only be executed if your site has a license for the Oracle Diagnostics pack (or Tuning pack), since it reads from AWR.
WITH
all_parameters AS (
SELECT snap_id,
       dbid,
       instance_number,
       parameter_name,
       value,
       isdefault,
       ismodified,
       lag(value) OVER (PARTITION BY dbid, instance_number, parameter_hash ORDER BY snap_id) prior_value
  FROM dba_hist_parameter
)
SELECT TO_CHAR(s.begin_interval_time, 'YYYY-MM-DD HH24:MI') begin_time,
       TO_CHAR(s.end_interval_time, 'YYYY-MM-DD HH24:MI') end_time,
       p.snap_id,
       p.dbid,
       p.instance_number,
       p.parameter_name,
       p.value,
       p.isdefault,
       p.ismodified,
       p.prior_value
  FROM all_parameters p,
       dba_hist_snapshot s
 WHERE p.value != p.prior_value
   AND s.snap_id = p.snap_id
   AND s.dbid = p.dbid
   AND s.instance_number = p.instance_number
 ORDER BY
       s.begin_interval_time DESC,
       p.dbid,
       p.instance_number,
       p.parameter_name
/
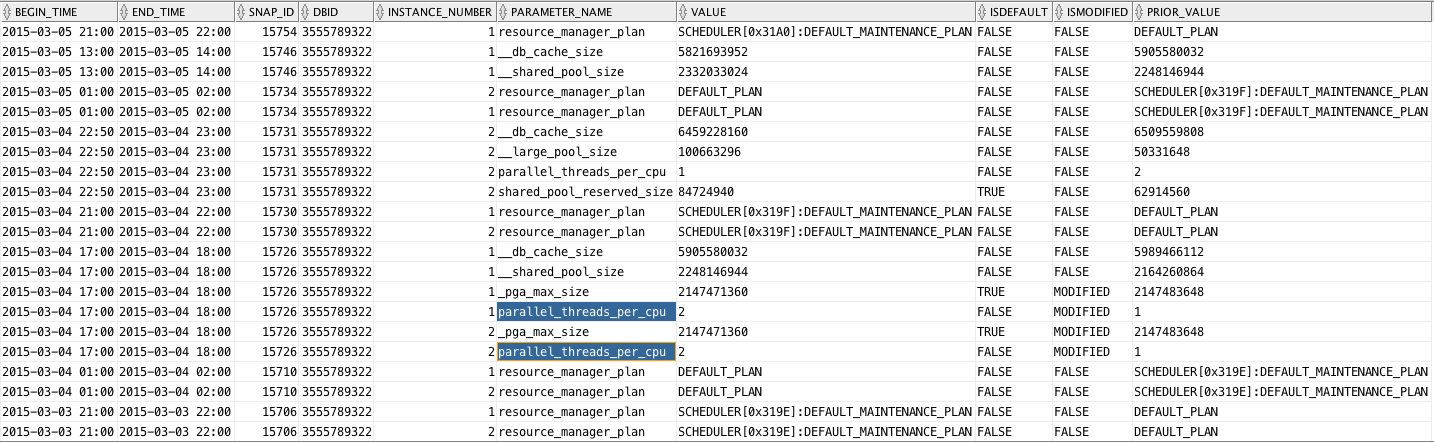
Sample output follows, where we can see a parameter affecting Degree of Parallelism was changed. This is just to illustrate its use. Enjoy this new free script! It is now part of edb360.
eDB360
An Oracle Database 360-degree View
 eDB360 is a free tool that executes on an Oracle database and produces a compressed file which includes a large set of small Reports. This set of Reports provides a 360-degree view of an Oracle Database. eDB360 is mostly used for one of the following 3 reasons, listed here in order of frequency of use: 1) Keystone of an Oracle database Health-Check. 2) Kick-off for an Oracle database Performance Evaluation. 3) High-level view of System Resources demand and utilization for an Oracle database Sizing and Provisioning project.
Usually, Developers, Sys Admins and Consultants are not given open access to a database in a Production environment. This eDB360 free tool helps approved users to become familiar with an Oracle database in a non-intrusive way. Without installing anything on the database, the eDB360 tool connects to an Oracle database and produces a large set of flat files that can be reviewed offline while using an HTML browser or a Text editor.
eDB360 can be executed by someone with very limited access to an Oracle database (i.e. a Developer, Sys Admin or Consultant with just query access to the Data Dictionary views); or if executed by an authorized DBA, there is no actual need to provide any additional access to the Oracle database to the party requesting eDB360.
eDB360 works on 10gR2, 11gR2, and on higher releases of Oracle; and it can be used on Linux or UNIX Platforms. It has not been tested on Windows.
Instructions
Download the eDB360 tool and review the readme.md file included. Uncompress the master ZIP file on the Database Server of interest. Navigate to the main (master) directory and execute script edb360.sql connected as SYS or any other account with access to the Data Dictionary views (a DBA account is not required but it is preferred).
Execution time for eDB360 may exceed 1 hour, depending on the size of the Data Dictionary. And the size of the output may reach 1 GB, so be sure you execute this tool from a file system directory with at least 1 GB or free space. Common sizes of the output range between 10 and 100 MB.
eDB360 has only one required execution parameter:
- Oracle Pack License: A big portion of the information presented by eDB360 comes from Oracle’s Automatic Workload Repository (AWR), and AWR is licensed by Oracle under the Diagnostics Pack. A small part of the output of eDB360 comes from the SQL Monitoring repository, which is part of the Oracle Tuning Pack. This parameter accepts one of 3 values: “T”, “D” or “N”. If you database is licensed under the Oracle Tuning Pack, enter then the value of “T”. If your database is not licensed to use the Oracle Tuning Pack but it is licensed to use the Oracle Diagnostics Pack, enter “D” then. If your site is not licensed on any of these two Oracle Packs, enter “N” then. Be aware that a value of “N” reduces substantially the content and value of the output. Thus the preferred parameter value is “T” (Oracle Tuning Pack).
Sample
# unzip edb360-master.zip
# cd edb360-master
# sqlplus / as sysdba
SQL> @edb360.sql T
Download
eDB360, now part of SQLdb360, is available as free-to-use software. You can see its readme.md, license.txt or any other piece of the tool before downloading it.
Feedback
Please post your feedback about this eDB360 tool at this blog, or send and email directly to the tool author: Carlos Sierra.
Free script to very quickly and cheaply estimate the size of an index if it were to be rebuilt
A good friend of mine recently asked me if edb360 included a section showing indexes that would benefit of a rebuild. I replied “not yet” and basically committed to add something. This topic of the needs versus the implications of rebuilding an index has been recently discussed in Richard Foote’s Blog. In my opinion, if you want to know more about indexes, Richard’s blog is one of the first stops. To my surprise and delight, I learned that we can actually use a little trick of the EXPLAIN PLAN FOR command and actually use the CBO to estimate what would be the size of an index if we were to create (or rebuild) it. In this latter blog posting Richard explains and demonstrates how it can be done.
My blog posting today is about encapsulating this cool method to quickly and cheaply estimate the size of an index if it were to be rebuilt, and put it on a free script for the Oracle community to use. So, feel free to use script below, but I need to remind you that before you jump to conclusions that this or that index should be rebuilt, read first about the actual need of doing so. You may want to include in your reading Richard Foote’s numerous postings on this topic, and also a couple of Oracle MOS notes: 989093.1 and 989186.1
----------------------------------------------------------------------------------------
--
-- File name:   estimate_index_size.sql
--
-- Purpose:     Reports Indexes with an Actual size > Estimated size for over 1 MB
--
-- Author:      Carlos Sierra
--
-- Version:     2014/07/18
--
-- Description: Script to very quickly and cheaply estimate the size of an index if it
--              were to be rebuilt. It uses EXPLAIN PLAN FOR CREATE INDEX technique.
--              It can be used on a single index, or all the indexes on a table, or
--              a particular application schema, or all application schemas. It does not
--              lock indexes and only updates the plan_table, which is usually a global
--              temporary table.
--
-- Usage:       Connect to SQL*Plus as SYS or DBA account and execute without parameters.
--              It will ask for optional schema owner, table name and index name. If all
--              3 are given null values then it acts on all application schemas. It
--              generates a simple text report with the indexes having an estimated size
--              of at least 1 MB over their actual size.
--
-- Example:     @estimate_index_size.sql
--
-- Notes:       Developed and tested on 11.2.0.3.
--
--              Inspired on blog posts from Richard Foote and Connor MacDonald:
--              http://richardfoote.wordpress.com/2014/04/24/estimate-index-size-with-explain-plan-i-cant-explain/#comment-116966
--              http://connormcdonald.wordpress.com/2012/05/30/index-size/
--
--              If considering index rebuilds based on the output of this script, read
--              first Richard Foote's numerous blog postings about this topic. Bottom
--              line: there are only a few cases where you actually need to manually
--              rebuild an index.
--
--              This method to estimated size of an index is far from perfect, please
--              scrutinize this script before using it. You may also want to read
--              Oracle MOS notes: 989093.1 and 989186.1 on this topic.
--
---------------------------------------------------------------------------------------
--
SPO estimate_index_size.txt;
UNDEF owner table_name index_name exclusion_list exclusion_list2;
DEF exclusion_list = "('ANONYMOUS','APEX_030200','APEX_040000','APEX_SSO','APPQOSSYS','CTXSYS','DBSNMP','DIP','EXFSYS','FLOWS_FILES','MDSYS','OLAPSYS','ORACLE_OCM','ORDDATA','ORDPLUGINS','ORDSYS','OUTLN','OWBSYS')";
DEF exclusion_list2 = "('SI_INFORMTN_SCHEMA','SQLTXADMIN','SQLTXPLAIN','SYS','SYSMAN','SYSTEM','TRCANLZR','WMSYS','XDB','XS$NULL')";
VAR random1 VARCHAR2(30);
VAR random2 VARCHAR2(30);
EXEC :random1 := DBMS_RANDOM.string('A', 30);
EXEC :random2 := DBMS_RANDOM.string('X', 30);
DELETE plan_table WHERE statement_id IN (:random1, :random2);

SET SERVEROUT ON;
DECLARE
  sql_text CLOB;
BEGIN
  FOR i IN (SELECT idx.owner, idx.index_name
              FROM dba_indexes idx,
                   dba_tables tbl
             WHERE idx.owner = NVL(UPPER(TRIM('&&owner.')), idx.owner) -- optional schema owner name
               AND idx.table_name = NVL(UPPER(TRIM('&&table_name.')), idx.table_name) -- optional table name
               AND idx.index_name = NVL(UPPER(TRIM('&&index_name.')), idx.index_name) -- optional index name
               AND idx.owner NOT IN &&exclusion_list. -- exclude non-application schemas
               AND idx.owner NOT IN &&exclusion_list2. -- exclude more non-application schemas
               AND idx.index_type IN ('NORMAL', 'FUNCTION-BASED NORMAL', 'BITMAP', 'NORMAL/REV') -- exclude domain and lob
               AND idx.status != 'UNUSABLE' -- only valid indexes
               AND idx.temporary = 'N'
               AND tbl.owner = idx.table_owner
               AND tbl.table_name = idx.table_name
               AND tbl.last_analyzed IS NOT NULL -- only tables with statistics
               AND tbl.num_rows > 0 -- only tables with rows as per statistics
               AND tbl.blocks > 128 -- skip small tables
               AND tbl.temporary = 'N')
  LOOP
    BEGIN
      sql_text := 'EXPLAIN PLAN SET STATEMENT_ID = '''||:random1||''' FOR '||REPLACE(DBMS_METADATA.get_ddl('INDEX', i.index_name, i.owner), CHR(10), ' ');
      -- cbo estimates index size based on explain plan for create index ddl
      EXECUTE IMMEDIATE sql_text;
      -- index owner and name do not fit on statement_id, thus using object_owner and object_name, using statement_id as processing state
      DELETE plan_table WHERE statement_id = :random1 AND (other_xml IS NULL OR NVL(DBMS_LOB.instr(other_xml, 'index_size'), 0) = 0);
      UPDATE plan_table SET object_owner = i.owner, object_name = i.index_name, statement_id = :random2 WHERE statement_id = :random1;
    EXCEPTION
      WHEN OTHERS THEN
        DBMS_OUTPUT.PUT_LINE(i.owner||'.'||i.index_name||': '||SQLERRM);
        DBMS_OUTPUT.PUT_LINE(DBMS_LOB.substr(sql_text));
    END;
  END LOOP;
END;
/
SET SERVEROUT OFF;

WITH
indexes AS (
SELECT pt.object_owner,
       pt.object_name,
       TO_NUMBER(EXTRACTVALUE(VALUE(d), '/info')) estimated_bytes
  FROM plan_table pt,
       TABLE(XMLSEQUENCE(EXTRACT(XMLTYPE(pt.other_xml), '/*/info'))) d
 WHERE pt.statement_id = :random2
   AND pt.other_xml IS NOT NULL -- redundant
   AND DBMS_LOB.instr(pt.other_xml, 'index_size') > 0 -- redundant
   AND EXTRACTVALUE(VALUE(d), '/info/@type') = 'index_size' -- grab index_size type
),
segments AS (
SELECT owner, segment_name, SUM(bytes) actual_bytes
  FROM dba_segments
 WHERE owner = NVL(UPPER(TRIM('&&owner.')), owner) -- optional schema owner name
   AND segment_name = NVL(UPPER(TRIM('&&index_name.')), segment_name) -- optional index name
   AND owner NOT IN &&exclusion_list. -- exclude non-application schemas
   AND owner NOT IN &&exclusion_list2. -- exclude more non-application schemas
   AND segment_type LIKE 'INDEX%'
HAVING SUM(bytes) > POWER(2, 20) -- only indexes with actual size > 1 MB
 GROUP BY
       owner,
       segment_name
),
list_bytes AS (
SELECT (s.actual_bytes - i.estimated_bytes) actual_minus_estimated,
       s.actual_bytes,
       i.estimated_bytes,
       i.object_owner,
       i.object_name
  FROM indexes i,
       segments s
 WHERE i.estimated_bytes > POWER(2, 20) -- only indexes with estimated size > 1 MB
   AND s.owner = i.object_owner
   AND s.segment_name = i.object_name
)
SELECT ROUND(actual_minus_estimated / POWER(2, 20)) actual_minus_estimated,
       ROUND(actual_bytes / POWER(2, 20)) actual_mb,
       ROUND(estimated_bytes / POWER(2, 20)) estimated_mb,
       object_owner owner,
       object_name index_name
  FROM list_bytes
 WHERE actual_minus_estimated > POWER(2, 20) -- only differences > 1 MB
 ORDER BY
       1 DESC,
       object_owner,
       object_name
/

DELETE plan_table WHERE statement_id IN (:random1, :random2);
UNDEF owner table_name index_name exclusion_list exclusion_list2;
SPO OFF;
Why using SQLTXPLAIN
Every so often I see on a distribution list a posting that starts like this: “I upgraded my application from database release X to release Y and now many queries are performing poorly, can you tell why?”
As everyone else on a distribution list, my first impulse is to make an educated guess permeated by a prior set of experiences. The intentions are always good, but the process is painful and time consuming. Many of us have seen this kind of question, and many of us have good hunches. Still I think our eagerness to help blinds us a bit. The right thing to do is to step back and analyze the facts, and I mean all the diagnostics supporting the observation.
What is needed to diagnose a SQL Tuning issue?
The list is large, but I will enumerate some of the most important pieces:
- SQL Text
- Version of the database (before and after upgrade)
- Database parameters (before and after)
- State of the CBO Statistics (before and after)
- Changes on Histograms
- Basics about the architecture (CPUs, memory, etc.)
- Values of binds if SQL has them
- Indexes compare, including state (visible?, usable?)
- Execution Plan (before and after)
- Plan stability? (Stored Outlines, Profiles, SQL Plan Management)
- Performance history as per evidence on AWR or StatsPack
- Trace from Event 10053 to understand the CBO
- Trace from Event 10046 level 8 or 12 to review Waits
- Active Session History (ASH) if 10046 is not available
I could keep adding bullets to the list, but I think you get the point: There are simply too many things to check! And each takes some time to collect. More important, the state of the system changes overtime, so you may need to re-collect the same diagnostics more than once.
SQLTXPLAIN to the rescue
SQLT or SQLTXPLAIN, has been available on MetaLink (now MOS) under note 215187.1 for over a decade. In short, SQLT collects all the diagnostics listed above and a lot more. That is WHY Oracle Support uses it every day. It simply saves a lot of time! So, I always encourage fellow Oracle users to make use of the FREE tool and expedite their own SQL Tuning analysis. When time permits, I do volunteer to help on an analysis. So, if you get to read this, and you want to help yourself while using SQLT but feel intimidated by this little monster, please give it a try and contact me for assistance. If I can help, I will, if I cannot, I will let you know.
Conclusion
It is fun to guess WHY a SQL is not performing as expected, and trying different guesses is educational but very time consuming. If you want to actually find root causes before trying to fix your SQL, you may want to collect relevant diagnostics. SQLT is there to help, and if installing this tool is not something you can do in a short term, consider then SQL Health-Check SQLHC.
What is new with EDB360?
Many things, but most important is that it got bigger and better. This EDB360 free tool provided is maturing over time. Its core function has not changed although, which is to present a 360-degree view of a database (10g or higher).
EDB360 is a nice complement to other tools like Exacheck, Raccheck or Oracheck. It has some additional benefits, like taking a snapshot of a system to then be analyzed offline or simply to preserve this snapshot as a baseline.
Keep in mind that EDB360 does not install anything on the database, nor it changes any data on it. In some cases, where direct access to the database server is not an option, having the capability of executing EDB360 through a SQL*Plus client connection is a big plus.
I use EDB360 as a starting place to perform a whole database health-check.
Since pictures tell more than words, please find below 4. The first two are about the new entries on EDB360 main menu (menu is a tad bigger than what you see in these two pictures, and its content is dynamic). The last two pictures are just a sample of the charts that are now part of EDB360.
EDB360 execution parameters changed from 4 to 6:
- Oracle Pack License: If your site has the Tuning Pack, then enter ‘T’, else if your site has the Diagnostics Pack enter ‘D’, else enter ‘N’.
- Days of History to consider. If you entered ‘T’ or ‘D’ on first parameter, then specify on 2nd parameter up to how many days of history you want EDB360 to use. By default it uses 31, assuming your AWR history is at least that big.
- Do you want HTML Reports? By default it is ‘Y’.
- Do you want Text Reports? Defaults to ‘Y’.
- Do you want CSV Files? Defaults to ‘Y’.
- Do you want Charts? Defaults to ‘Y’.
Once you login into SQL*Plus while on top of the edb360 directory, simply execute script edb360.sql and pass all 6 parameters one by one or all of them inline. For example: @edb360 T 31 Y Y Y Y
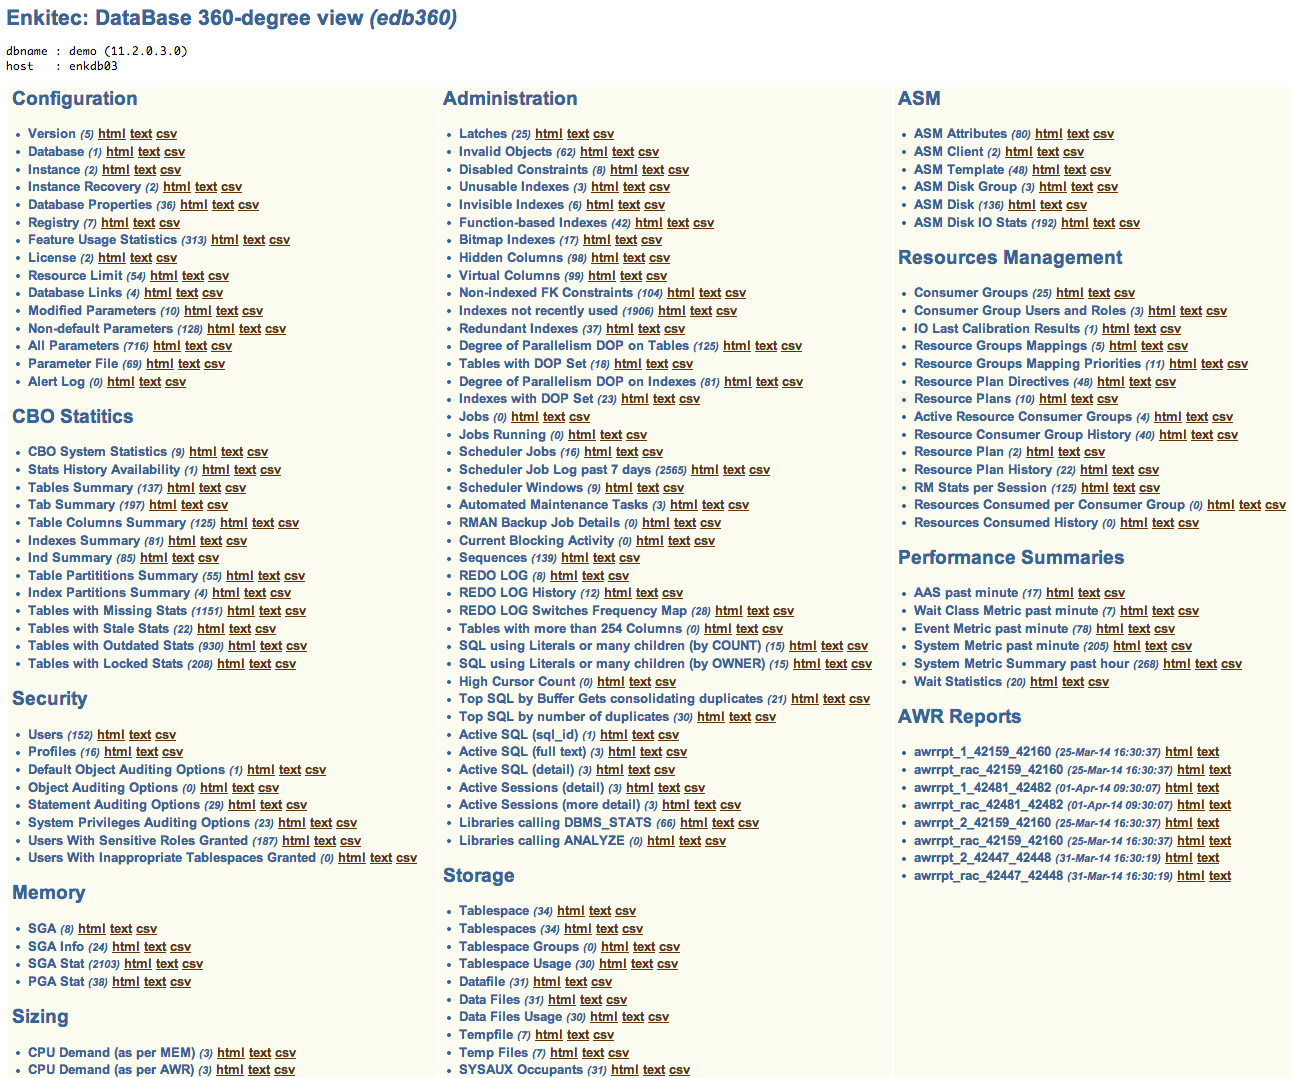
EDB360 Dynamic Menu (part 1)
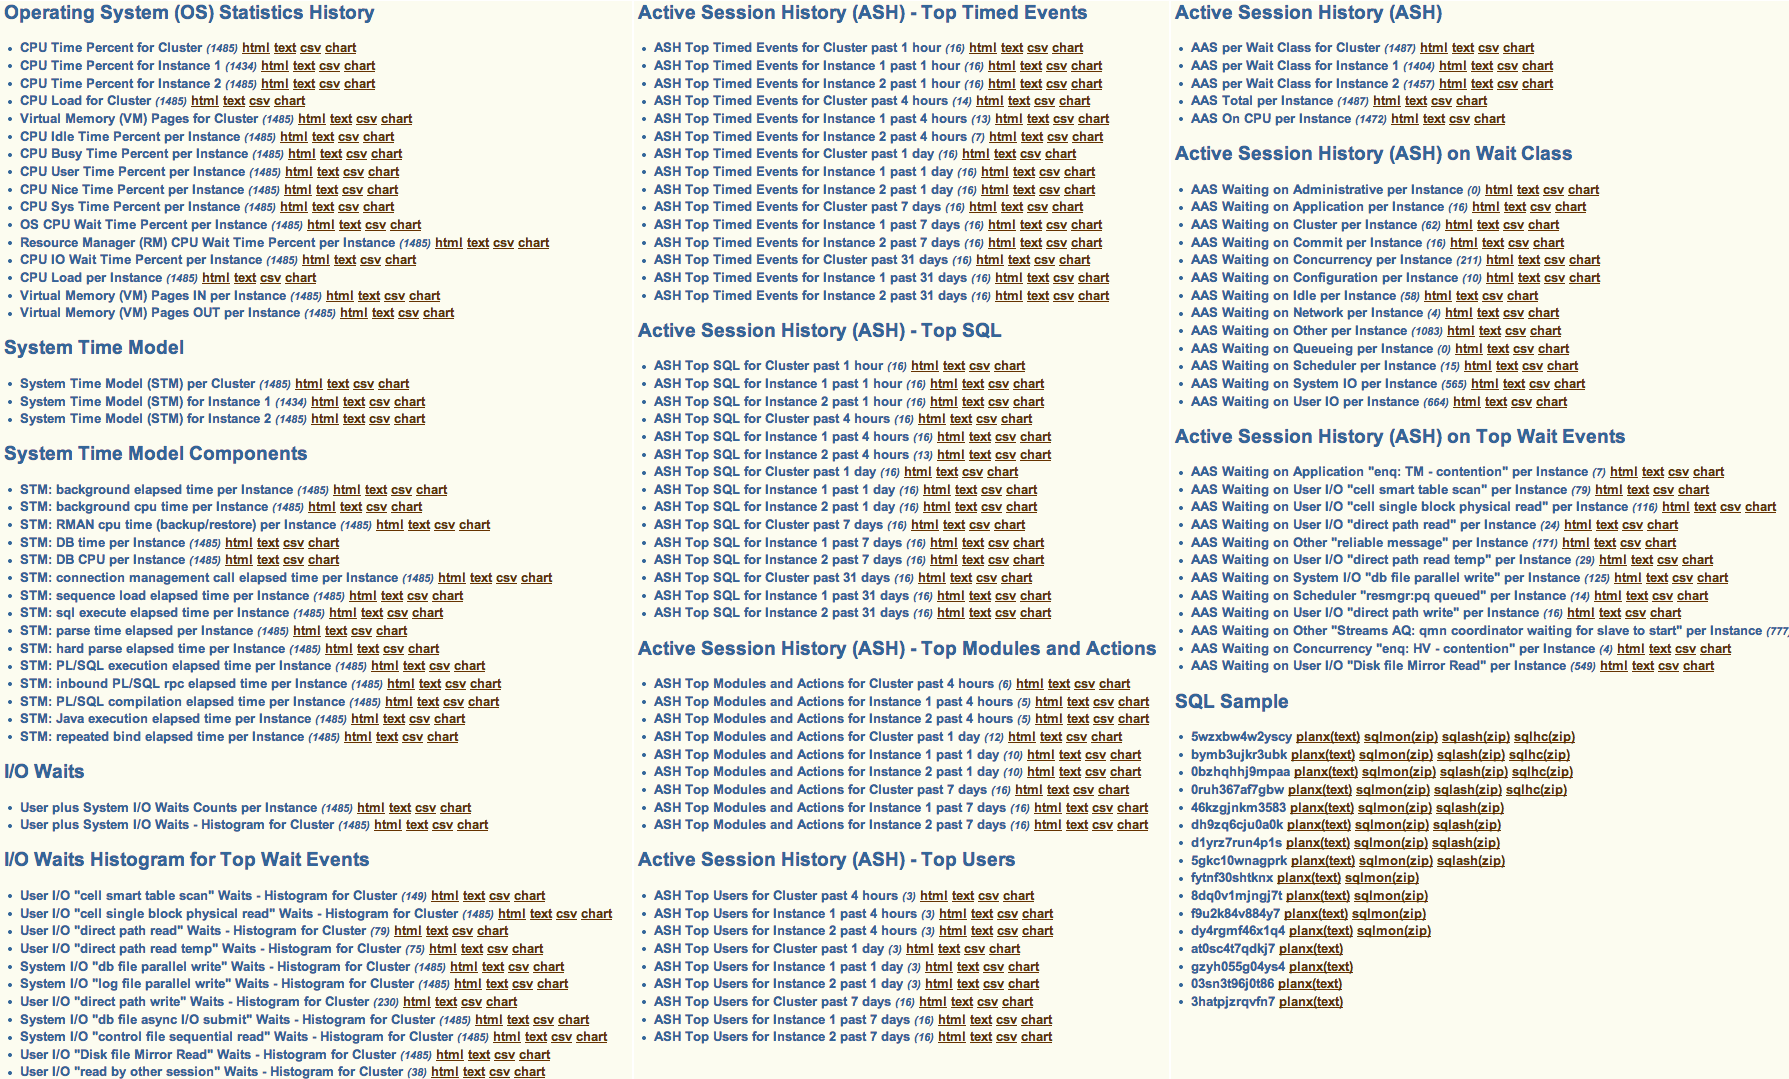
EDB360 Dynamic Menu (part 2)
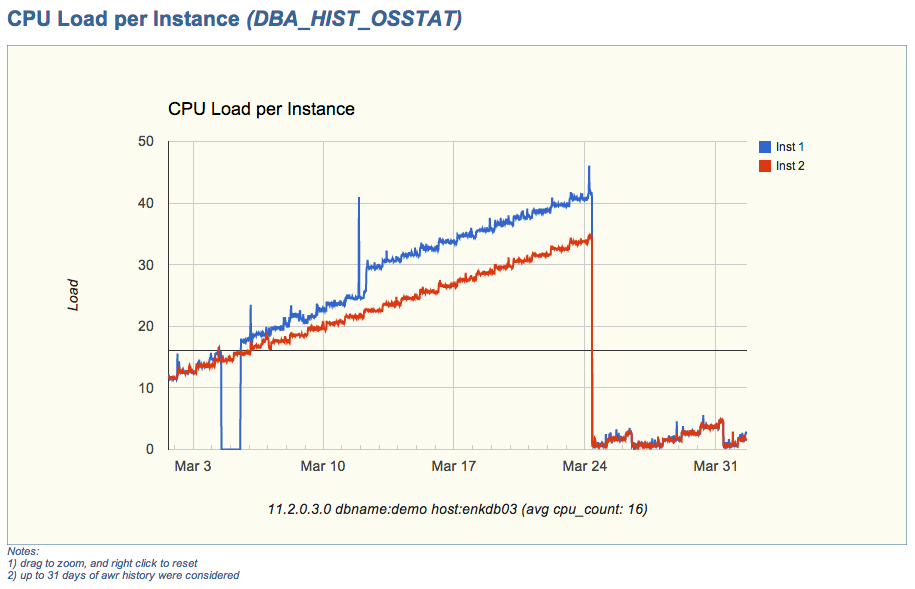
CPU Load per Instance (sample chart)
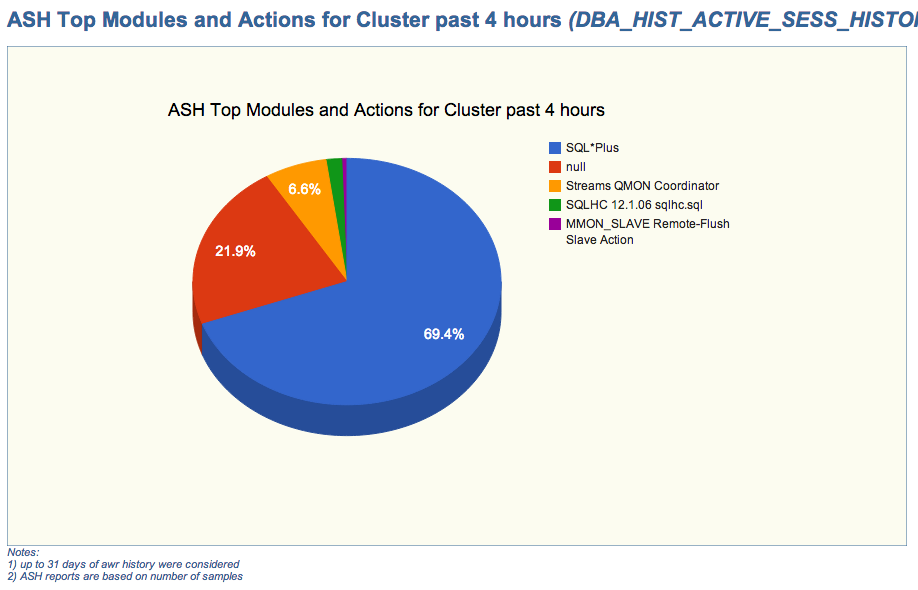
ASH Top Modules and Actions for Cluster (sample chart)
If you have downloaded EDB360 before, then I encourage you to download and test the new version. If you have never used it, I hope you find this tool useful.
Meet “edb360”: a free tool that provides a 360-degree view of an Oracle database
Simply put: edb360 is a new free tool that provides a 360-degree view of an Oracle database.
What is “edb360“?
This “edb360” tool is the product of a collaborative effort of some very smart guys, and me. Special thanks to Frits Hoogland, Karl Arao, Randy Johnson, Martin Bach, Kyle Hailey, Tanel Poder, Alex Fatkulin, Mauro Pagano, Abel Macias, Jon Adams and Jack Agustin. These guys helped me to envision edb360, some directly and some indirectly, but their help and shared knowledge motivated me to develop edb360 and make it available today.
The edb360 tool started as a quick and dirty “script” to gather basic information about a database without knowing anything about it before hand. The first rule for edb360 was: it has to install nothing in the database. The second rule became: it has to provide some insight about a database.
The output is presented for the most part into 3 formats: HTML, Text and Comma-separated Values (CSV). Why? HTML and Text can be easily used to consolidate important findings into a Word report. Sometimes HTML is more useful and sometimes Text is better. Then CSV is used to produce charts out of Performance Trends. Some people can visualize trends easier with a graph (me included).
What about other tools?
Of course there are wonderful tools that can help in this arena, like Oracle Enterprise Manager (OEM) or Oracle’s Automatic Workload Repository (AWR). So why not using those tools? Well, if I had access to OEM or I knew before hand which time intervals I want to analyze with AWR, then I would not have a strong need to use edb360. The reality that we consultants face when we are getting acquainted of a system, is that we are not given any access to the database of interest (usually production). And asking for a server account feels like asking for coke’s secret formula: then we simply cannot poke the database at our own will, and that is understandable. So, what is our second best?: please run this script that installs nothing and generates a zip file with some metadata from your system. The script is plain text and its output is also plain text (html, text and csv files). So, any DBA or System Administration can validate that no customer confidential data is extracted or exposed. A win-win!
If the system we want to understand is an Exadata system, we can also request for an Exacheck output, if not an Exadata system but a RAC cluster, there is Raccheck. These two tools, available though My Oracle Support (MOS) make a good companion for the edb360. In other words, edb360 is not a replacement for the other two but more of an add-on or companion.
Why is edb360 free?
Why not? Often I get asked: why do you give away the tools and scripts you develop? The answer is simple: tools, scripts, white papers, blog entries like this, in my mind they all represent the same: sharing knowledge with our Oracle community. I wish for a community where knowledge (and tools) flows for all to benefit. Let’s say my personal time I invest building tools and scripts kinds of make it up for my lame blog postings. 😉
What is the catch?
No catch. Just be aware that edb360 makes use of some DBA_HIST views and ASH data, and those are part of the Oracle Diagnostics Pack. So when executing the tool it will ask to indicate if your site has those licenses. Your answer determines the scope of the output. So if you specify you have a license for the Oracle Diagnostics Pack then your edb360 output includes pieces from AWR and ASH, else AWR and ASH are not accessed.
About versions, feedback and support
For the most part, I am committed to maintain this tool as my personal time permits. That means I can only work on it during odd hours and not every day. Nothing different than SQLTXPLAIN during the first few years of its existence, so I am not scared. Keep also in mind this edb360 is work in progress, and version v1405 is the first one I feel comfortable sharing with the community. In other words, it is far from perfect and I foresee it growing in multiple directions.
If you like this tool, and want to enhance its output, get SQLHC from MOS 1366133.1, and place the sqlhc.sql script into the same db360/sql directory. By doing so, you will also get 3 SQL health-checks. In other words, edb360 is SQLHC aware.
Conclusion
If you like free tools and have a use for this edb360 tool, you might as well download it and give it a shot. Nothing to lose (besides a few minutes of your spare time). A sample output is also available under same link above.
Life is Good!
Non-intrusive SQL Trace instrumentation on legacy PL/SQL code
Problem
Legacy PL/SQL code with intermittent performance degradation.
To improve the performance of this code, the first step is to diagnose it. But this code has no instrumentation whatsoever, it is in Production, and rolling any code into Production usually requires rigorous testing. So, whatever method we implement has to be light-weight and as safe as possible.
Using Oradebug is not a viable solution mainly for two reasons: It misses the “head” of the transaction, so we may not get to know the SQL taking longer; and second, internal procedures from finding about the issue, reporting it, then acting on it may take from several minutes to hours.
Solution
- Identify which PL/SQL libraries are known to be problematic in terms of intermittent performance degradation.
- At the beginning of each callable PL/SQL Procedure or Function, add a call to DBMS_APPLICATION_INFO.SET_MODULE to set some appropriate MODULE and ACTION, for example “R252, LOAD”. Call this API also at the end, to NULL out these two parameters. This code change is very small and safe. It introduces practically no overhead. It simply labels every SQL executed by the PL/SQL library with some MODULE and ACTION that uniquely identify the code of concern.
- Activate SQL Trace on the module/action that needs to be traced, by calling DBMS_MONITOR.SERV_MOD_ACT_TRACE_ENABLE, passing parameters SERVICE, MODULE and ACTION. With this API request a SQL Trace to be generated with WAITs and BINDs (binds are optional but desirable). Once these traces are no longer needed (reviewed by someone), turn SQL Trace off using API DBMS_MONITOR.SERV_MOD_ACT_TRACE_DISABLE.
- Once the SQL Trace is produced, generate a TKPROF on it. You may want to include parameter “sort=exeela fchela”. This way you get the slower SQL at the top of the TKPROF report.
- With SQL Trace and TKPROF, identify the slower SQL and use SQL Monitor and/or SQL XTRACT to get more granular diagnostics (you need to identify SQL_ID). On any given PL/SQL library, it is common that 1~5 SQL statements consume > 80% of the Elapsed Time. Focus on these large consumers.
Conclusion
Producing a SQL Trace with EVENT 10046 level 8 or 12 is very useful to properly diagnose the code on a PL/SQL library which performs poorly. A follow-up on the slower SQL with SQL Monitor and/or SQLT XTRACT is in order. The method presented above is very easy and safe to implement.
Counting rows fast
A friend of mine asked me last night basically this: “How is that SQLTXPLAIN counts rows?”. In particular, he was referring to the use of the SAMPLE clause of the SELECT statement. Look at this SQLT’s log piece:
SQL_ID a9x1kc4ymyhkz
--------------------
SELECT /*+ FULL(t) PARALLEL */ COUNT(*) * 1e4
FROM "XYPZ"."INSTRUMENT" SAMPLE (.01) t

SQL_ID 025v6k1032t69
--------------------
SELECT /*+ FULL(t) PARALLEL */ COUNT(*) * 1e5
FROM "XYPZ"."POSITION_COMPOSITION" SAMPLE (.001) t

SQL_ID 8rby3340xpd9k
--------------------
SELECT /*+ FULL(t) PARALLEL */ COUNT(*) * 1e5
FROM "XYPZ"."POSITION_EVENT" SAMPLE (.001) t
WHY is it that SQLT has to count rows?
SQLT has to count rows so it can report side by side DBA_TABLES.NUM_ROWS and COUNT(*) from each Table. This is an easy way to see if your statistics are way off, and this mechanism exists on SQLT well before DBA_TAB_MODIFICATIONS came to existence. Actually, SQLT uses both methods to health-check how stale are your Table statistics.
The conundrum here is: “I use SQLT because I want to diagnose a performance issue on a QUERY on top of large Tables, but I do not want SQLT to take a long time just to produce a COUNT(*) of my Tables…”.
Fast versus Precise
In Performance tuning, there is always a trade-off. You want X but you sacrifice B. Counting rows is no different. Do you want it faster? Then you sacrifice precision. The SAMPLE clause of the SELECT statement allows you to do exactly that (syntax below):
SAMPLE [ BLOCK ] ( sample_percent ) [ SEED ( seed_value ) ]
So, if you specify a 10% sample size then you have to multiply the COUNT(*) by 10. If you sample 1% you multiply the COUNT(*) by 100. In large Tables if you sample, lets say 0.1%, your multiplier becomes 1,000, which is the same than 1e3 (10**3 or 10^3 depending where you went to school). Sample size can be as small as 0.000,001 and as large as 100 (but without including 100 itself). It represents probabilities more than an actual sample size.
The optional BLOCK clause simple says: use sample blocks instead of rows. And the optional SEED clause tries to provide some consistency in the result of the count when you use the same value for two executions of the exact same count. This SEED clause takes a value between 0 and 4,294,967,295.
How SQLT counts rows?
SQLT has over 40 tool parameters. One of them is count_star_threshold with a seeded value of 10,000.
SQLT includes a small algorithm (below) that determines the size of the SAMPLE according to the estimated size of the Table itself, by looking at its statistics as per DBA_TABLES.NUM_ROWS. No statistics? then skip the sample and do a normal full scan. If the Table is expected to be smaller then the count_star_threshold, then do a full scan. So is up to 10x this threshold. After that, use a sample size proportionally inverse to the Table size. The bigger the Table the smaller the Sample.
SQLT also forces a full Table scan and invokes Parallel Execution (PX) as a method to expedite the count. This count can be really fast on Exadata systems as you can imagine.
 /* -------------------------
 *
 * private perform_count_star
 *
 * called by: sqlt$i.common_calls and sqlt$i.remote_xtract
 *
 * ------------------------- */
 PROCEDURE perform_count_star (p_statement_id IN NUMBER)
 IS
 l_sql VARCHAR2(32767);
 l_number NUMBER;
 l_count NUMBER;
 BEGIN
 write_log('=> perform_count_star');

IF sqlt$a.get_param_n('count_star_threshold') = 0 THEN
 write_log('skip "count_star" as per corresponding parameter');
 ELSE
 FOR i IN (SELECT owner, table_name, num_rows, source
 FROM &&tool_administer_schema..sqlt$_dba_all_tables_v
 WHERE statement_id = p_statement_id
 ORDER BY
 owner, table_name)
 LOOP
 IF i.num_rows IS NULL THEN
 l_sql := 'SELECT /*+ FULL(t) PARALLEL */ COUNT(*)
FROM "'||i.owner||'"."'||i.table_name||'" t WHERE ROWNUM <= :number';
 l_number := sqlt$a.get_param_n('count_star_threshold');
 ELSIF i.num_rows < sqlt$a.get_param_n('count_star_threshold') THEN
 l_sql := 'SELECT /*+ FULL(t) PARALLEL */ COUNT(*)
FROM "'||i.owner||'"."'||i.table_name||'" t WHERE ROWNUM <= :number';
 l_number := sqlt$a.get_param_n('count_star_threshold') * 10;
 ELSIF i.num_rows < (sqlt$a.get_param_n('count_star_threshold') * 1e1) THEN
 l_sql := 'SELECT /*+ FULL(t) PARALLEL */ COUNT(*) * 1e1
FROM "'||i.owner||'"."'||i.table_name||'" SAMPLE (:number) t';
 l_number := 1e1;
 ELSIF i.num_rows < (sqlt$a.get_param_n('count_star_threshold') * 1e2) THEN
 l_sql := 'SELECT /*+ FULL(t) PARALLEL */ COUNT(*) * 1e2
FROM "'||i.owner||'"."'||i.table_name||'" SAMPLE (:number) t';
 l_number := 1e0;
 ELSIF i.num_rows < (sqlt$a.get_param_n('count_star_threshold') * 1e3) THEN
 l_sql := 'SELECT /*+ FULL(t) PARALLEL */ COUNT(*) * 1e3
FROM "'||i.owner||'"."'||i.table_name||'" SAMPLE (:number) t';
 l_number := 1/1e1;
 ELSIF i.num_rows < (sqlt$a.get_param_n('count_star_threshold') * 1e4) THEN
 l_sql := 'SELECT /*+ FULL(t) PARALLEL */ COUNT(*) * 1e4
FROM "'||i.owner||'"."'||i.table_name||'" SAMPLE (:number) t';
 l_number := 1/1e2;
 ELSIF i.num_rows < (sqlt$a.get_param_n('count_star_threshold') * 1e5) THEN
 l_sql := 'SELECT /*+ FULL(t) PARALLEL */ COUNT(*) * 1e5
FROM "'||i.owner||'"."'||i.table_name||'" SAMPLE (:number) t';
 l_number := 1/1e3;
 ELSIF i.num_rows < (sqlt$a.get_param_n('count_star_threshold') * 1e6) THEN
 l_sql := 'SELECT /*+ FULL(t) PARALLEL */ COUNT(*) * 1e6
FROM "'||i.owner||'"."'||i.table_name||'" SAMPLE (:number) t';
 l_number := 1/1e4;
 ELSIF i.num_rows < (sqlt$a.get_param_n('count_star_threshold') * 1e7) THEN
 l_sql := 'SELECT /*+ FULL(t) PARALLEL */ COUNT(*) * 1e7
FROM "'||i.owner||'"."'||i.table_name||'" SAMPLE (:number) t';
 l_number := 1/1e5;
 ELSE
 l_sql := 'SELECT /*+ FULL(t) PARALLEL */ COUNT(*) * 1e8
FROM "'||i.owner||'"."'||i.table_name||'" SAMPLE (:number) t';
 l_number := 1/1e6;
 END IF;

l_sql := REPLACE(l_sql, ':number', l_number);
 write_log('num_rows='||i.num_rows||' sql='||l_sql);
 l_count := NULL;

BEGIN
 EXECUTE IMMEDIATE l_sql INTO l_count;
 write_log(l_count||' rows counted');
 EXCEPTION
 WHEN OTHERS THEN
 write_log('** '||SQLERRM);
 write_log(l_sql||' failed with error above. Process continues.');
 END;

IF l_count IS NOT NULL THEN
 IF i.source = 'DBA_TABLES' THEN
 UPDATE &&tool_repository_schema..sqlt$_dba_tables
 SET count_star = l_count
 WHERE statement_id = p_statement_id
 AND owner = i.owner
 AND table_name = i.table_name;
 ELSIF i.source = 'DBA_OBJECT_TABLES' THEN
 UPDATE &&tool_repository_schema..sqlt$_dba_object_tables
 SET count_star = l_count
 WHERE statement_id = p_statement_id
 AND owner = i.owner
 AND table_name = i.table_name;
 END IF;
 END IF;
 END LOOP;

COMMIT;
 END IF;

write_log('<= perform_count_star');
 END perform_count_star;
Conclusion
Counting rows is like counting beans, you can count one at a time, or you can take some shortcuts. If you are willing to sacrifice some precision for the sake of gaining performance, consider then using the SAMPLE clause of the SELECT statement.
A healthy way to do an Oracle database health-check
Q: How do I do an Oracle database health-check?
A: It all depends. (hint: we can use this answer for most Oracle related questions in general and Performance related in particular, but don’t try it at home).
This seems like a quite broad question and yes it is. And of course there are many ways to proceed with a database health-check. So at this post I ‘d rather talk about: what I think is a healthy way to approach an Oracle database health-check.
- Start with the basics: Listen to the users of this database. If nobody complains then most probably you would have to define the scope by yourself. In any case, go on.
- Gather environment information. This includes the understanding of the architecture used, the databases on such architecture and the applications on those databases. Also learn who is who: Users, DBAs and Developers.
- Gather metrics. I am referring to OS metrics (CPU, IO and Memory), and also database metrics (AWR) together with alert logs. When gathering these metrics focus on time periods where the pain has been reported, and slice the time as small as possible (i.e. AWR reports for each time slice captured, avoiding the 6-24 hours time frame common mistake).
- Let the combination of complains (concerns) and findings on metrics to guide you to the next step. This is where most get lost. So don’t panic and dive in into what you see as contention on your metrics. Keep in mind that the most important metric of all is “user response time”, so anything affecting it must be in your priority list.
- There are many more things to check, but they are more in the configuration and sound practices arena. For example: redundancy on control files, archive mode, backups, non-default parameters, PX setup, memory setup, etc. For these, creating a check list would help.
- At some point you will have many leads and you will start to lose focus. Do some yoga or go for a walk, then make an A, B, C list with what is really important, what is kind-of and what is mere style.
- You are not an expert on every aspect of the database (nobody is). So, do not pretend you can do everything yourself. Rely on your peers and/or contacts. Reach out for help in those areas where you feel insecure (feeling insecure is a good thing, much better than feeling secure without any solid foundation).
- Once you think you have it nailed, go to your peers, colleagues, boss(es), friends, partner, or strangers if necessarily, and solicit a review of your findings and recommendations. Accept feedback. This is key. Maybe what you thought was sound it makes absolutely no sense to someone with more experience or simply with a different view.
- Reconsider everything. Avoid the pitfall of assuming that what you have learn in your two-digits years of experience can be applied to every case. For example, if you have done mostly SQL Tuning, don’t expect every issue to be SQL Tuning. Health-checks are like fortune cookies, you never know what you will get.
- Last but not least: Learn from your new experience, practice listening to others, use your common sense, exercise your knowledge, and work as a team member. Add the word “collaboration” to your daily work and maybe one day you will learn you are not alone.
Cheers — Carlos
