Archive for the ‘10053’ Category
Why using SQLTXPLAIN
Every so often I see on a distribution list a posting that starts like this: “I upgraded my application from database release X to release Y and now many queries are performing poorly, can you tell why?”
As everyone else on a distribution list, my first impulse is to make an educated guess permeated by a prior set of experiences. The intentions are always good, but the process is painful and time consuming. Many of us have seen this kind of question, and many of us have good hunches. Still I think our eagerness to help blinds us a bit. The right thing to do is to step back and analyze the facts, and I mean all the diagnostics supporting the observation.
What is needed to diagnose a SQL Tuning issue?
The list is large, but I will enumerate some of the most important pieces:
- SQL Text
- Version of the database (before and after upgrade)
- Database parameters (before and after)
- State of the CBO Statistics (before and after)
- Changes on Histograms
- Basics about the architecture (CPUs, memory, etc.)
- Values of binds if SQL has them
- Indexes compare, including state (visible?, usable?)
- Execution Plan (before and after)
- Plan stability? (Stored Outlines, Profiles, SQL Plan Management)
- Performance history as per evidence on AWR or StatsPack
- Trace from Event 10053 to understand the CBO
- Trace from Event 10046 level 8 or 12 to review Waits
- Active Session History (ASH) if 10046 is not available
I could keep adding bullets to the list, but I think you get the point: There are simply too many things to check! And each takes some time to collect. More important, the state of the system changes overtime, so you may need to re-collect the same diagnostics more than once.
SQLTXPLAIN to the rescue
SQLT or SQLTXPLAIN, has been available on MetaLink (now MOS) under note 215187.1 for over a decade. In short, SQLT collects all the diagnostics listed above and a lot more. That is WHY Oracle Support uses it every day. It simply saves a lot of time! So, I always encourage fellow Oracle users to make use of the FREE tool and expedite their own SQL Tuning analysis. When time permits, I do volunteer to help on an analysis. So, if you get to read this, and you want to help yourself while using SQLT but feel intimidated by this little monster, please give it a try and contact me for assistance. If I can help, I will, if I cannot, I will let you know.
Conclusion
It is fun to guess WHY a SQL is not performing as expected, and trying different guesses is educational but very time consuming. If you want to actually find root causes before trying to fix your SQL, you may want to collect relevant diagnostics. SQLT is there to help, and if installing this tool is not something you can do in a short term, consider then SQL Health-Check SQLHC.
SQL Tuning with SQLTXPLAIN 2-days Workshop
SQLTXPLAIN is a SQL Tuning tool widely used by the Oracle community. Available through My Oracle Support (MOS) under document 215187.1, this free tool is available for download and use to anyone with MOS access. It has helped thousands of times to expedite the resolution of SQL Tuning issues, and many Oracle DBAs and Developers benefit of its use on a daily basis.
Stelios Charalambides has done an excellent job writing a book on this topic. In his book Stelios covers many aspects about SQLTXPLAIN and some related topics. I highly recommend to get a copy of this book if you want to learn more about SQLTXPLAIN. It is available at Amazon and many other retailers.
The new 2-days SQLTXPLAIN Workshop offered by Enkitec (an Oracle Platinum business partner and my employer) is a completely new course that interleaves “how to use effectively SQLTXPLAIN” with important and related SQL Tuning Topics such as Plan Flexibility and Plan Stability. This hands-on workshop offers participants the unique opportunity to fully understand the contents of SQLTXPLAIN and its vast output through an interactive session. About half the time is dedicated to short guided labs, while the other half uses presentations and demos. This workshop is packed with lots of content. It was a real challenge packaging so much info in only two days, but I am very pleased with the result. It became a 2-days intensive knowledge transfer hands-on workshop on SQLTXPLAIN and SQL Tuning!
The first session of this workshop is scheduled for November 7-8 in Dallas, Texas. I expect this pilot session to fill out fast. Other sessions and onsite ones will be offered during 2014. I hope to meet many of you face to face on November 7!
WHY SQLT XTRACT produces two EVENT 10053 traces?
If you use SQLT XTRACT often, you may have noticed that in some cases the sqlt_sNNNNN_*.zip file contains two 10053 traces instead of one. The question is WHY?
Take for example this:
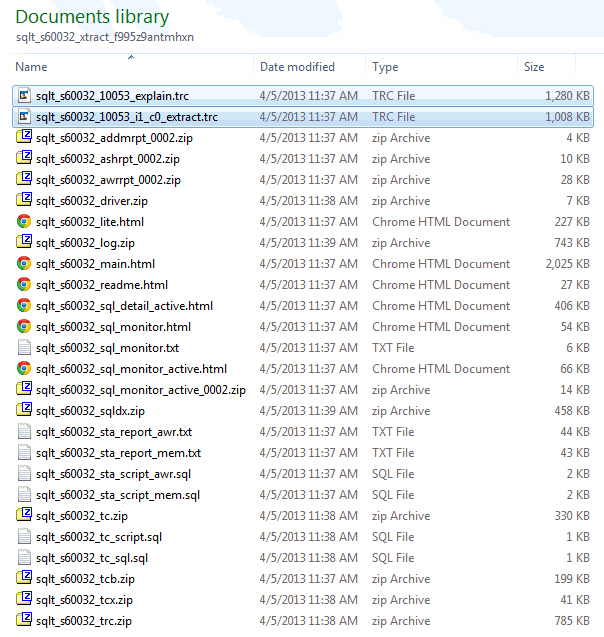
The first file reads “explain” and it is generated by enabling EVENT 10053 during an EXPLAIN PLAN FOR command on the SQL Text associated to the SQL_ID passed to SQLT XTRACT. So this 10053 may not be accurate if the SQL has binds and bind peeking is enabled.
The second file reads “i1_c0_extract’. The “i1” part means instance 1 and the “c0” means child cursor zero. This 10053 is generated by API SYS.DBMS_SQLDIAG.DUMP_TRACE which is available on 11.2 and higher.
When I see both files I usually focus on the one from the new API, since the “explain” may show a different plan than the one actually executed. In any case, look first at the Plans Summary section of SQLT main report and pay attention to the plan hash values. Then on your 10053 search for Plan Table and compare the hash value with the one from SQLT main report.
