Archive for the ‘PL/SQL’ Category
Query to get SQL_ID from DBA_SQL_PLAN_BASELINES
Doing a SQL Plan Baseline fleet cleanup, I wanted to get the SQL_ID give a SQL Plan Baseline. Long ago I wrote a PL/SQL function that inputs some SQL Text and outputs its SQL_ID . Then, I could use such function, passing the SQL Text from the SQL Plan Baseline (this is on 12c), and getting back the SQL_ID I need!
I tested this query below on 12.1.0.2, and it gives me exactly what I wanted: Input a SQL Plan Baseline, and output its SQL_ID. And all from a simple SQL query. Enjoy it! 🙂
/* from https://carlos-sierra.net/2013/09/12/function-to-compute-sql_id-out-of-sql_text/ */
/* based on http://www.slaviks-blog.com/2010/03/30/oracle-sql_id-and-hash-value/ */
WITH
FUNCTION compute_sql_id (sql_text IN CLOB)
RETURN VARCHAR2 IS
 BASE_32 CONSTANT VARCHAR2(32) := '0123456789abcdfghjkmnpqrstuvwxyz';
 l_raw_128 RAW(128);
 l_hex_32 VARCHAR2(32);
 l_low_16 VARCHAR(16);
 l_q3 VARCHAR2(8);
 l_q4 VARCHAR2(8);
 l_low_16_m VARCHAR(16);
 l_number NUMBER;
 l_idx INTEGER;
 l_sql_id VARCHAR2(13);
BEGIN
 l_raw_128 := /* use md5 algorithm on sql_text and produce 128 bit hash */
 SYS.DBMS_CRYPTO.hash(TRIM(CHR(0) FROM sql_text)||CHR(0), SYS.DBMS_CRYPTO.hash_md5);
 l_hex_32 := RAWTOHEX(l_raw_128); /* 32 hex characters */
 l_low_16 := SUBSTR(l_hex_32, 17, 16); /* we only need lower 16 */
 l_q3 := SUBSTR(l_low_16, 1, 8); /* 3rd quarter (8 hex characters) */
 l_q4 := SUBSTR(l_low_16, 9, 8); /* 4th quarter (8 hex characters) */
 /* need to reverse order of each of the 4 pairs of hex characters */
 l_q3 := SUBSTR(l_q3, 7, 2)||SUBSTR(l_q3, 5, 2)||SUBSTR(l_q3, 3, 2)||SUBSTR(l_q3, 1, 2);
 l_q4 := SUBSTR(l_q4, 7, 2)||SUBSTR(l_q4, 5, 2)||SUBSTR(l_q4, 3, 2)||SUBSTR(l_q4, 1, 2);
 /* assembly back lower 16 after reversing order on each quarter */
 l_low_16_m := l_q3||l_q4;
 /* convert to number */
 SELECT TO_NUMBER(l_low_16_m, 'xxxxxxxxxxxxxxxx') INTO l_number FROM DUAL;
 /* 13 pieces base-32 (5 bits each) make 65 bits. we do have 64 bits */
 FOR i IN 1 .. 13
 LOOP
 l_idx := TRUNC(l_number / POWER(32, (13 - i))); /* index on BASE_32 */
 l_sql_id := l_sql_id||SUBSTR(BASE_32, (l_idx + 1), 1); /* stitch 13 characters */
 l_number := l_number - (l_idx * POWER(32, (13 - i))); /* for next piece */
 END LOOP;
 RETURN l_sql_id;
END compute_sql_id;
SELECT compute_sql_id(sql_text) sql_id, signature
  FROM dba_sql_plan_baselines
/
SQLTXPLAIN PL/SQL Public APIs to execute XTRACT from 3rd party tools
Many tools offer Public APIs, which expose some functionality to other tools. SQLTXPLAIN contains also some Public APIs. They are provided by package SQLTXADMIN.SQLT$E. I would say the most relevant one is XTRACT_SQL_PUT_FILES_IN_DIR. This blog post is about this Public API and how it can be used by other tools to execute a SQLT XTRACT from PL/SQL instead of SQL*Plus.
Imagine a tool that deals with SQL statements, and with the click of a button it invokes SQLTXTRACT on a SQL of interest, and after a few minutes, most files created by SQLTXTRACT suddenly show on an OS pre-defined directory. Implementing this SQLT functionality on an external tool is extremely easy as you will see below.
Public API SQLTXADMIN.SQLT$E.XTRACT_SQL_PUT_FILES_IN_DIR inputs a SQL_ID and two other optional parameters: A tag to identify output files, and a directory name. Only SQL_ID parameter is mandatory, and the latter two are optional, but I recommend to pass values for all 3.
I used “Q1” as a tag to be included in all output files. And I used staging directory “FROG_DIR” at the database layer, which points to “/home/oracle/frog” at the OS layer.
On sample below, I show how to use this Public API for a particular SQL_ID “8u0n7w1jug5dg”. I call this API from SQL*Plus, but keep in mind that if I were to call it from within a tool’s PL/SQL library, the method would be the same.
Another consideration is that Public API SQLTXADMIN.SQLT$E.XTRACT_SQL_PUT_FILES_IN_DIR may take several minutes to execute, so you may want to “queue” the request using a Task or a Job within the database. What is important here on this blog post is to explain and show how this Public API works.
SQLTXADMIN.SQLT$E.XTRACT_SQL_PUT_FILES_IN_DIR parameters:
Find below code snippet showing API Parameters. Notice this API is overloaded, so it may return the STATEMENT_ID or nothing. This STATEMENT_ID is the 5 digits number you see on each SQLT execution.
CREATE OR REPLACE PACKAGE &&tool_administer_schema..sqlt$e AUTHID CURRENT_USER AS
/* $Header: 215187.1 sqcpkge.pks 12.1.03 2013/10/10 carlos.sierra mauro.pagano $ */

  /*************************************************************************************/

  /* -------------------------
   *
   * public xtract_sql_put_files_in_dir
   *
   * executes sqlt xtract on a single sql then
   * puts all generated files into an os directory,
   * returning the sqlt statement id.
   *
   * ------------------------- */
  FUNCTION xtract_sql_put_files_in_dir (
    p_sql_id_or_hash_value IN VARCHAR2,
    p_out_file_identifier  IN VARCHAR2 DEFAULT NULL,
    p_directory_name       IN VARCHAR2 DEFAULT 'SQLT$STAGE' )
  RETURN NUMBER;

  /* -------------------------
   *
   * public xtract_sql_put_files_in_dir (overload)
   *
   * executes sqlt xtract on a single sql then
   * puts all generated files into an os directory.
   *
   * ------------------------- */
  PROCEDURE xtract_sql_put_files_in_dir (
    p_sql_id_or_hash_value IN VARCHAR2,
    p_out_file_identifier  IN VARCHAR2 DEFAULT NULL,
    p_directory_name       IN VARCHAR2 DEFAULT 'SQLT$STAGE' );
Staging Directory
To implement Public API SQLTXADMIN.SQLT$E.XTRACT_SQL_PUT_FILES_IN_DIR on your tool, you need first to create and test a staging directory where the API will write files. This directory needs to be accessible to the “oracle” account, so I show below how to create sample directory “frog” while connected to the OS as “oracle”.
Since the API uses UTL_FILE, it is important that “oracle” can write into it, so be sure you test this UTL_FILE write after you create the directory and before you test Public API SQLTXADMIN.SQLT$E.XTRACT_SQL_PUT_FILES_IN_DIR.
Use code snippet provided below to test the UTL_FILE writing into this new staging OS directory.
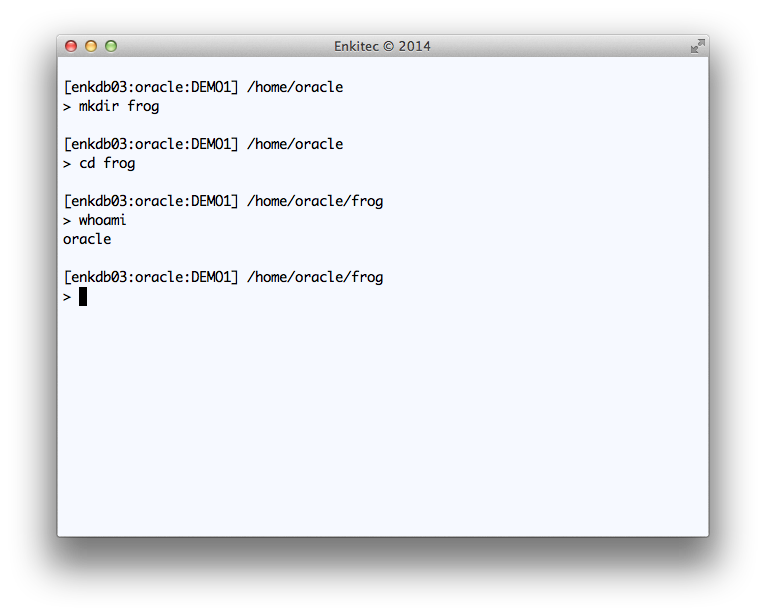
Creating “frog” OS directory connected to OS as “oracle”
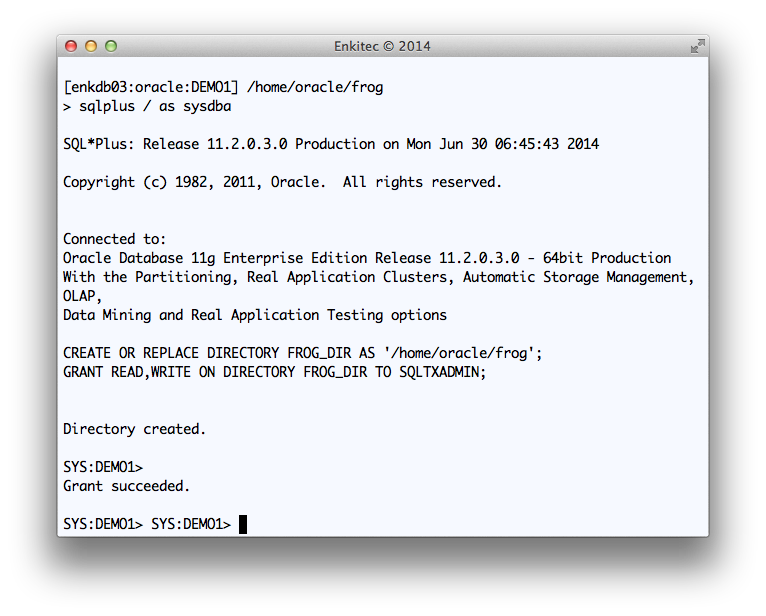
Creating FROG_DIR database directory and providing access to SQLTXADMIN
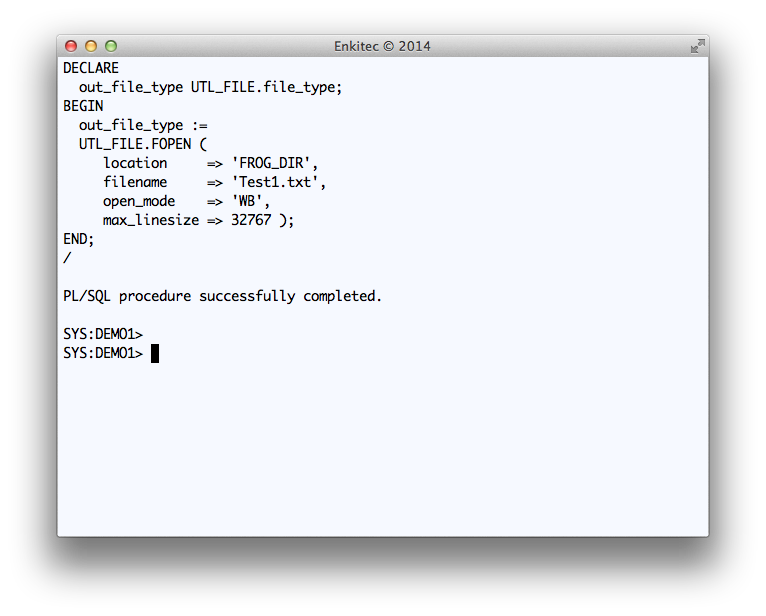
Testing a simple WRITE to FROG_DIR
DECLARE
  out_file_type UTL_FILE.file_type;
BEGIN
  out_file_type :=
  UTL_FILE.FOPEN (
     location     => 'FROG_DIR',
     filename     => 'Test1.txt',
     open_mode    => 'WB',
     max_linesize => 32767 );
END;
/
Executing SQLTXADMIN.SQLT$E.XTRACT_SQL_PUT_FILES_IN_DIR
On your tool, you can call this SQLT Public API from PL/SQL. You may want to use a Task or Job since the API may take several minutes to execute and you do not want the user to simply wait until SQLT completes.
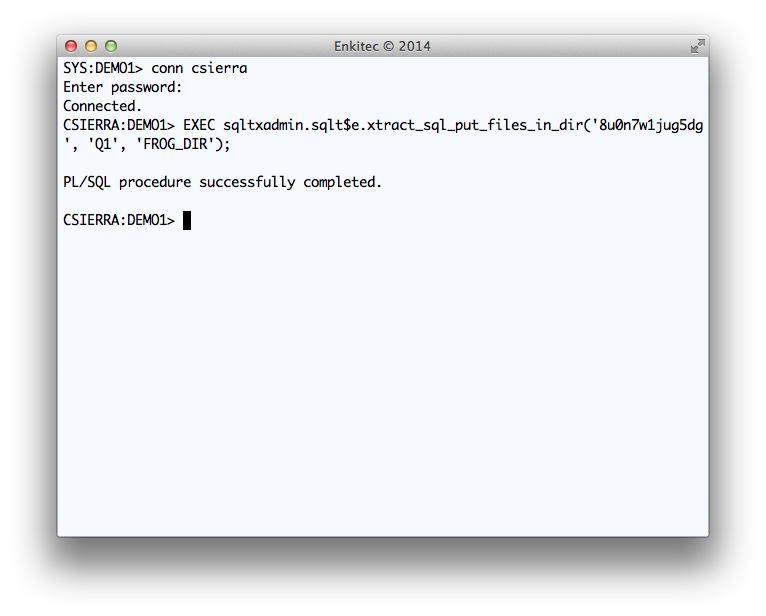
Execution of Public API SQLTXADMIN.SQLT$E.XTRACT_SQL_PUT_FILES_IN_DIR
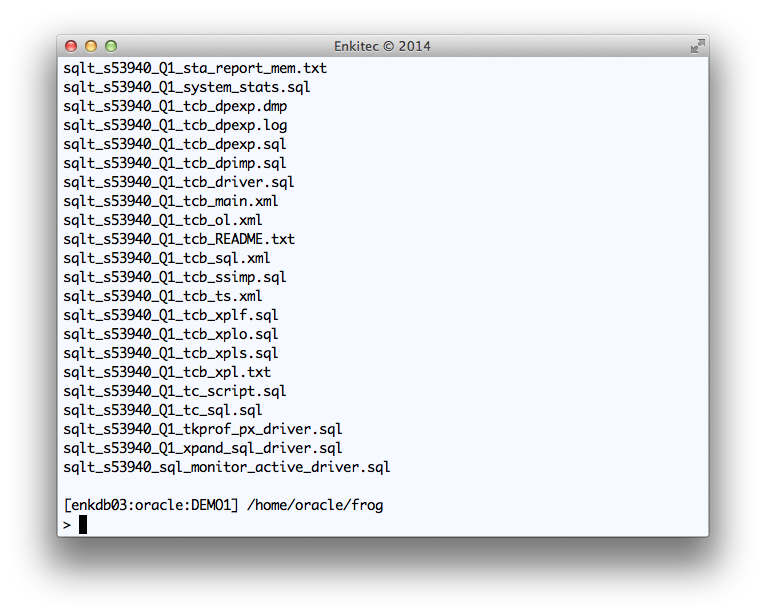
Reviewing the output of SQLT XTRACT for SQL_ID “8u0n7w1jug5dg”
Conclusion
Public API SQLTXADMIN.SQLT$E.XTRACT_SQL_PUT_FILES_IN_DIR is available for any 3rd party tool to use. If SQLT has been pre-installed on a system where your tool executes, then calling this API as shown above, will generate a set of SQLT files on a pre-defined staging OS directory.
If the system where you install your tool does not have SQLT pre-installed, your tool can direct its users to download and install SQLT out of My Oracle Support (MOS) under document 215187.1.
Once you generate all these SQLT XTRACT files into an OS staging directory, you may want to zip them, or make them visible to your tool user. If the latter, then show the “main” html report.
SQLT is an Oracle community tool hosted at Oracle MOS under 215187.1. This tool is not supported, but if you have a question or struggle while implementing this Public API, feel free to shoot me an email or post your question/concern on this blog.
Non-intrusive SQL Trace instrumentation on legacy PL/SQL code
Problem
Legacy PL/SQL code with intermittent performance degradation.
To improve the performance of this code, the first step is to diagnose it. But this code has no instrumentation whatsoever, it is in Production, and rolling any code into Production usually requires rigorous testing. So, whatever method we implement has to be light-weight and as safe as possible.
Using Oradebug is not a viable solution mainly for two reasons: It misses the “head” of the transaction, so we may not get to know the SQL taking longer; and second, internal procedures from finding about the issue, reporting it, then acting on it may take from several minutes to hours.
Solution
- Identify which PL/SQL libraries are known to be problematic in terms of intermittent performance degradation.
- At the beginning of each callable PL/SQL Procedure or Function, add a call to DBMS_APPLICATION_INFO.SET_MODULE to set some appropriate MODULE and ACTION, for example “R252, LOAD”. Call this API also at the end, to NULL out these two parameters. This code change is very small and safe. It introduces practically no overhead. It simply labels every SQL executed by the PL/SQL library with some MODULE and ACTION that uniquely identify the code of concern.
- Activate SQL Trace on the module/action that needs to be traced, by calling DBMS_MONITOR.SERV_MOD_ACT_TRACE_ENABLE, passing parameters SERVICE, MODULE and ACTION. With this API request a SQL Trace to be generated with WAITs and BINDs (binds are optional but desirable). Once these traces are no longer needed (reviewed by someone), turn SQL Trace off using API DBMS_MONITOR.SERV_MOD_ACT_TRACE_DISABLE.
- Once the SQL Trace is produced, generate a TKPROF on it. You may want to include parameter “sort=exeela fchela”. This way you get the slower SQL at the top of the TKPROF report.
- With SQL Trace and TKPROF, identify the slower SQL and use SQL Monitor and/or SQL XTRACT to get more granular diagnostics (you need to identify SQL_ID). On any given PL/SQL library, it is common that 1~5 SQL statements consume > 80% of the Elapsed Time. Focus on these large consumers.
Conclusion
Producing a SQL Trace with EVENT 10046 level 8 or 12 is very useful to properly diagnose the code on a PL/SQL library which performs poorly. A follow-up on the slower SQL with SQL Monitor and/or SQLT XTRACT is in order. The method presented above is very easy and safe to implement.
Displaying and fixing compilation errors on a SQLTXPLAIN package
If you are installing SQLTXPLAIN and for some reason you get a PL/SQL compilation error in a SQLT log like the one below, chances are the SHOW ERRORS command on SQL*Plus won’t show the actual error. This is because the installation connects as SYS and the packages are owned by SQLTXADMIN. In most cases the cause of the error is missing a GRANT or a SYNONYM in libraries called by SQLT like DBMS_METADATA or UTL_FILE.
... creating package body for SQLT$R
Warning: Package Body created with compilation errors.
No errors.
...
SELECT column_value libraries FROM TABLE(SQLTXADMIN.sqlt$r.libraries_versions)
ERROR at line 1:
ORA-04063: package body "SQLTXADMIN.SQLT$R" has errors
How to display PL/SQL package compilation error on SQLTXPLAIN
You may need to unlock the schema owner of SQLT packages and compile the invalid object connecting as this SQLTXADMIN account, then lock it back. By following steps below you will get to see the actual compile error. Then proceed to fix it and recompile the invalid package body. If it is a missing GRANT/SYNONYM you may want to create the GRANT EXECUTE of the SYS library to SQLTXADMIN then create a SYNONYM with same name (not a PUBLIC SYNONYM). Ex: GRANT EXECUTE ON SYS.DBMS_METADATA TO SQLTXADMIN; CREATE SYNONYM SQLTXADMIN.DBMS_METADATA FOR SYS.DBMS_METADATA;
$ cd sqlt/install
$ sqlplus / AS SYSDBA
--
SQL> SELECT object_name, object_type FROM dba_objects WHERE owner = 'SQLTXADMIN' AND object_type LIKE 'PACKAGE%' AND status = 'INVALID';
SQL> START sqcommon1.sql
SQL> GRANT CREATE SESSION TO sqltxadmin;
SQL> ALTER USER sqltxadmin IDENTIFIED BY &&password. ACCOUNT UNLOCK;
SQL> CONN sqltxadmin/&&password.;
--
-- compile invalid packages as per query output above
--
SQL> ALTER PACKAGE sqlt$m COMPILE;
SQL> ALTER PACKAGE sqlt$r COMPILE;
--
-- fix root cause of error
--
SQL> CONN / AS SYSDBA
SQL> REVOKE CREATE SESSION FROM sqltxadmin;
SQL> ALTER USER sqltxadmin PASSWORD EXPIRE ACCOUNT LOCK;
Understanding SQLTXPLAIN Health-Checks
SQLTXPLAIN (SQLT) collects diagnostics details about a SQL statement that either performs poorly or it produces unexpected results (also known as wrong results). In addition to that, it also performs over a hundred health-checks around the SQL statement being analyzed. The results of these so called health-checks are displayed on the main HTML report under the “Observations” section. Within each observation there is description of the meaning and in some cases a pointer to known bugs or notes. Since there are so many health-checks, it happens that every once in a while we want to dig further into WHY we get this “observation”. If that is your case and you understand SQL and PL/SQL, I invite you to “hack” into the SQLT source code and see how this health-check is triggered.
Finding WHY SQLT triggered a particular Health-Check
Assume you get this “observation” in your main HTML report “Table contains 2 column(s) referenced in predicates where the number of distinct values does not match the number of buckets.“.
Open sqlt/install/sqcpkgh.pkb (this h is for health-checks) and search for a portion of this text “number of distinct values does not match the number of buckets”. You will find a piece of code that looks like this:
 -- 10174050 frequency histograms with less buckets than ndv
 BEGIN
 SELECT COUNT(*)
 INTO l_count
 FROM sqlt$_dba_all_table_cols_v
 WHERE statement_id = p_tab_rec.statement_id
 AND owner = p_tab_rec.owner
 AND table_name = p_tab_rec.table_name
 AND histogram = 'FREQUENCY'
 AND num_distinct <> num_buckets
 AND in_predicates = 'TRUE';

IF l_count > 0 THEN
 s_obs_rec.type_id := E_TABLE;
 s_obs_rec.object_type := 'TABLE';
 s_obs_rec.object_name := p_tab_rec.owner||'.'||p_tab_rec.table_name;
 s_obs_rec.observation := 'Table contains '||l_count||' column(s) referenced in predicates where the number of distinct values does not match the number of buckets.';
 s_obs_rec.more := 'Review <a href="#tab_cols_cbo_'||p_tab_rec.object_id||'">column statistics</a> for this table and look for "Num Distinct" and "Num Buckets". If there are values missing from the frequency histogram you may have Bug 10174050. If you are referencing in your predicates one of the missing values the CBO can over estimate table cardinality, and this may produce a sub-optimal plan. As a workaround: alter system/session "_fix_control"=''5483301:off'';';
 ins_obs;
 END IF;
 END;
In this case the health-check derives from view sqlt$_dba_all_table_cols_v. You can find all view definitions inside file sqlt/install/sqcvw.sql. This file shows that view sqlt$_dba_all_table_cols_v selects from tables sqlt$_dba_tab_cols and sqlt$_dba_nested_table_cols.
There is a predicate on the health-check that reads “num_distinct <> num_buckets“. So this condition is what triggered this particular health-check.
In some cases, the column driving the health-check is an addition to the base DBA or GV$ views, so in such cases you may have to search for that column in one of these two packages: sqlt/install/sqcpkgd.pkb or sqlt/install/sqcpkgt.pkb. Where the “d” stands for Diagnostics data collection and the “t” for Transformation of diagnostics data.
Conclusion
When you get a SQLT health-check that is of your concern and you need to find out WHY it was raised, you may need to look into SQLT source code. Always start on the “h” module and continue either in view definitions or in the two packages that seed special columns. Those two packages “d” and “t” are the ones responsible for data collection and transformations.
SQLT source code is transparent. It is written in an easy to follow style. Feel free to reverse engineer any part of it. No mysteries, no hidden pieces, no black magic…
About DBA_TAB_HISTOGRAMS.ENDPOINT_VALUE
If you have looked at the values on DBA_TAB_HISTOGRAMS.ENDPOINT_VALUE you may have seen some like 281422806648623000000000000000000000 when you were actually expecting something like 63736. I have used in SQLT the two functions below for many years. I got the foundations of these two out of a public source which unfortunately I did not record. Since you may or not may have SQLT, I thought a good idea to share these two functions in case you need them.
CREATE OR REPLACE
FUNCTION get_internal_value (p_value IN VARCHAR2)
RETURN VARCHAR2
IS
 temp_n NUMBER := 0;
BEGIN
 FOR i IN 1..15
 LOOP
 temp_n := temp_n + POWER(256, 15 - i) * ASCII(SUBSTR(RPAD(p_value, 15, CHR(0)), i, 1));
 END LOOP;
 RETURN TO_CHAR(ROUND(temp_n, -21));
EXCEPTION
 WHEN OTHERS THEN
 RETURN p_value;
END get_internal_value;
/

CREATE OR REPLACE
FUNCTION get_external_value (p_value IN VARCHAR2)
RETURN VARCHAR2
IS
 temp_n NUMBER;
 temp_i INTEGER;
 my_result VARCHAR2(32767) := NULL;

BEGIN
 IF LENGTH(p_value) != 36 OR
 SUBSTR(p_value, 16) != '000000000000000000000' OR
 p_value > POWER(256, 15) OR
 p_value < POWER(256, 14) THEN
 RETURN p_value; -- cannot get external value
 END IF;

temp_n := p_value / POWER(256, 14); -- get most significant digits

-- decoding most significant digits then shift multiplying by 256
 FOR i IN 1..14
 LOOP
 temp_i := TRUNC(temp_n);
 temp_n := (temp_n - temp_i) * 256;
 IF temp_i NOT BETWEEN 32 AND 126 OR temp_n NOT BETWEEN 32 AND 126 THEN
 EXIT; -- reached the tail
 END IF;
 my_result := my_result||CHR(temp_i); -- all but last byte
 END LOOP;

IF temp_i NOT BETWEEN 32 AND 126 THEN
 RETURN my_result||'?'; -- cannot decode
 END IF;

-- scan to the right starting at temp_i
 FOR i IN temp_i..126
 LOOP
 IF get_internal_value(my_result||CHR(i)) = p_value THEN
 RETURN my_result||CHR(i); -- approximate value
 END IF;
 END LOOP;

-- scan to the left starting at temp_i
 FOR i IN 32..temp_i
 LOOP
 IF get_internal_value(my_result||CHR(temp_i + 32 - i)) = p_value THEN
 RETURN my_result||CHR(temp_i + 32 - i); -- approximate value
 END IF;
 END LOOP;

RETURN my_result||CHR(temp_i); -- this is the best we could do
EXCEPTION
 WHEN OTHERS THEN
 RETURN p_value;
END get_external_value;
/

SELECT get_external_value('281422806648623000000000000000000000')
FROM DUAL;

GET_EXTERNAL_VALUE('281422806648623000000000000000000000')
----------------------------------------------------------
63736

SELECT get_internal_value('63736') FROM DUAL;

GET_INTERNAL_VALUE('63736')
----------------------------------------------------------
281422806648623000000000000000000000
SQLTXPLAIN (SQLT) 11.4.4.6 is now available
So what is new in SQLT 11.4.4.6? Honestly, not much: one fix and 6 enhancements:
- BUG: SQLT TC “restore” was allowing a column to be renamed from “a” to “b” then from “b” to “c”, so it was ending up with duplicate rows in histogram among other issues.
- ENH: New tool parameter to control the automatic generation of a script with a Custom SQL Profile for best performing plan. Custom SQL Profiles based on DBMS_SQLTUNE.IMPORT_SQL_PROFILE are now inactive by default.
- ENH: New HC detecting corrupt histograms as per bugs 8543770, 10267075, 12819221 and 12876988.
- ENH: New HC reporting Tables where there are columns referenced in predicates and for which the number of distinct values has changed more than 10% from one statistics version to the next. These abrupt changes can cause an execution plan to also change.
- ENH: New HC about CBO not using partition level histograms if stats were gathered with “INCREMENTAL” and fix for bug 13583722 has been applied.
- ENH: Scripts roxtract.sql and roxecute.sql include now System Parameters with non-default or with modified values. They also report on all initialization paramaters for the connecting instance.
- ENH: All SQLT main methods ask now for the SQLTXPLAIN password in-line instead of using an ACCEPT command.
What is new, is that 3 satellite tools got also a new version. They can be downloaded from their own MOS note. They are also packaged within SQLT under directory sqlt/utl:
New profiler.sql script to nicely report top time consumers out of PL/SQL Profiler (DBMS_PROFILER) data
PL/SQL Profiler has been around for more than a decade. With DBMS_PROFILER we can “profile” the execution of PL/SQL code. This is great when the poor performance happens in PL/SQL code and not necessarily due to SQL statements from those PL/SQL libraries. In such cases Trace/TKPROF are not the right tools for the job since they do not include PL/SQL commands.
Once we use PL/SQL Profiler in our application, we get as output some data in 3 Tables. This “profile” data is populated by the PL/SQL engine at the end of the “profile” run, or as we flush this “profile” data from memory.
If you are using PL/SQL Profiler and you want to produce a nice and concise HTML report that shows which are the top 5 code lines in terms of their execution time, then you may want to use the new version of the profiler.sql script out of MOS Doc ID: 243755.1. This document has been around for a decade or so, but I just re-wrote the profiler.sql script. This new and very improved version is available as of today.
Also, within the same document (note), you can find an output sample. This sample would give you some idea how it would look if used with your application libraries.
