Archive for the ‘ASH’ Category
eDB360 new features (March 2017)

As many of you know, eDB360 is a free tool that provides a 360-degree view of an Oracle database without any installation. A new version is available like once per month, but occasionally a large number of enhancements are implemented at once. This new release v1708 (March 25, 2017) includes several new features requested recently by some users of the tool, thus the need to blog about what is new:
- Reducing the scope of eDB360 is now possible without having to generate a custom configuration file. Prior to this version, if a user wanted to generate output for let’s say AWR reports only (section 7a), the tool needed a custom.sql file with line DEF edb360_sections = ‘7a’;. Then we would pass to edb360.sql as 2nd execution parameter the name of this custom configuration file (too cumbersome!). Starting on v1708, we can directly pass to edb360.sql the section that we desire (i.e. SQL> @edb360 T 7a). This 2nd parameter can either input the name of a custom configuration file (legacy functionality), but now it also accepts a column, a section, a list of columns or a list of sections; for example: 7a, 7, 7a-7b, 1-4 and 3 are all valid values.
- A couple of reports were added to section 3h: “SQL in logon storms” and “SQL executed row-by-row”. The former identifies those SQL statements that are seen frequently on very short-lived sessions (based on ASH), and the latter presents a list of SQL statements with large number of executions and small number of rows processed.
- eDB360 now extracts ASH from eAdam for top 16 SQL_ID (as per SQLd360 list) + top 12 SNAP_ID (as per AWR MAX from column 7a). What it means is that eDB360 includes now a tar file with raw ASH data for both: SQL statements of interest and for AWR periods of interest (both according to what eDB360 considers important). Using eAdam is easy, so when content of eDB360 does not include a very specific aggregation of ASH data that we need, or when we have to understand the sequence of some ASH samples for example, we can then restore this eAdam data on any Oracle database and data mine it.
- Some reports on section 2b show now totals at the bottom. That is to SUM some numeric values. Other reports may follow in future releases.
- RMAN section includes now a new report “Blocks with Corruption or Non-logged”.
- Added Load Profile (Per Sec, Per Txn and Count) as per DBA_HIST_SYSMETRIC_SUMMARY. This Load Profile resembles what we see on AWR at the top, but this is computed for the entire period of diagnostics (31 days by default). It shows max values, average, median and several percentiles. With this new report on section 1a, we can glance over it and discover in minutes some areas of further interest, for example: logons per second too high, just to mention one.
- There is a new section 4i with “Waits Count v.s. Average Latency for top 24 Wait Events”. With this set of 24 reports (one for each of the top wait events) we can observe if patterns on the number of counts relate to patterns on the latency for such wait event; for example we are able to see if an increase in the number of waits for db file sequential reads correlates to an increase of average latency for such wait event. We can also observe cases were latency for a wait event cannot be explained by load on current database, thus hinting an external influence.
- Fixed “ORA-01476: divisor is equal to zero” on planx at DBA_HIST_SQLSTAT.
- Added AWR DIFF reports for RAC and per instance. These are computed comparing MAX reports to MEDIAN reports, and they help to quickly identify large differences on load. These new AWR DIFF reports are regulated by configuration parameter edb360_conf_incl_addm_rpt (enabled by default). They exist on 11R2 and higher.
- Added the ASH Analytics Active report for 12c. This new ASH report is regulated by configuration parameter edb360_conf_incl_ash_analy_rpt (enabled by default). This applies to 12c and higher.
- The name of the database is now part of the main filename. Some users requested to include this database name as part of the main zip file since they are using eDB360 periodically on several databases. This new feature is regulated by configuration parameter edb360_conf_incl_dbname_file (disabled by default).
- At completion, main eDB360 zip file can now by automatically moved to a location other than the standard SQL*Plus working directory. All output files are still generated on the local SQL*Plus directory from where the script edb360.sql is executed (i.e. edb360-master directory), but at the completion of the execution the consolidated output zip file is now moved to a location specified by a new parameter. This new feature is regulated by configuration parameter edb360_move_directory (disabled by default).
- Added new report on “Database and Schema Triggers” under column 3h. This new report can be used to see potential LOGON or other global triggers. For triggers on specific tables, refer to SQLd360 which is automatically included on eDB360 for top SQL.
- All queries executed by eDB360 to generate its output were modified. New format is q'[query]’. Reason for this change is to improve readability of the code.
Always download and use the latest version of this tool. For questions or feedback email me. And I hope you get to enjoy eDB360 as much as I do!
edb360 taking a long time
In most cases edb360 takes less than 1hr to execute. But I often hear of cases where it takes a lot longer than that. In a corner case it was taking several days and it had to be killed.
So the question is WHY edb360 takes that long?
Well, edb360 executes thousands of SQL statements sequentially (intentionally). Many of these queries read data from AWR and in particular from ASH. So, lets say your ASH historical table has 2B rows, and on top of that you have not gathered statistics on AWR tables in years, thus CBO under-estimates cardinality and tends to use index access and nested loops. In such extreme cases you may end up with suboptimal execution plans that expect to return a few rows, but actually read a couple of billion rows using index access operations and nested loops. A query like this may take hours to complete!
As of version v1515, edb360 has a shortcut algorithm that ends an execution after 8 hours. So you may get an incomplete output, but it ends normally and the partial output can actually be used. This is not a solution but a workaround for those long executions.
How to troubleshoot edb360 taking long?
Steps:
1. Review files 00002_edb360_dbname_log.txt, 00003_edb360_dbname_log2.txt, 00004_edb360_dbname_log3.txt and 00005_edb360_dbname_tkprof_sort.txt. First log shows the state of the statistics for AWR Tables. If stats are old then gather them fresh with script edb360/sql/gather_stats_wr_sys.sql
2. If number of rows on WRH$_ACTIVE_SESSION_HISTORY as per 00002_edb360_dbname_log.txt is several millions, then you may not be purging data periodically. There are some known bugs and some blog posts on this regard. Review MOS 387914.1 and proceed accordingly. Execute query below to validate ASH age:
SELECT TRUNC(sample_time, 'MM'), COUNT(*)
  FROM dba_hist_active_sess_history
 GROUP BY TRUNC(sample_time, 'MM')
 ORDER BY TRUNC(sample_time, 'MM')
 /
3. If edb360 version (first line on its readme) is older than 1 month, download and use latest version: https://github.com/carlos-sierra/edb360/archive/master.zip (link is also provided on the right-hand side of this blog under downloads).
4. Consider suppressing text and or csv reports. Each for an estimated gain of about 20%. Keep in mind that when suppressing reports, you start loosing some functionality. To suppress lets say text and csv reports, place the following two commands at the end of script edb360/sql/edb360_00_config.sql
DEF edb360_conf_incl_text = ‘N’;
DEF edb360_conf_incl_csv = ‘N’;
5. If after going through steps 1-4 above, edb360 still takes longer than a few hours, feel free to email author carlos.sierra.usa@gmail.com and provide 4 files from step 1.
How to identify SQL performing poorly on an APEX application?
Oracle Application Express (APEX) is a great tool to rapidly develop applications on top of an Oracle database. While developing an internal application we noticed that some pages were slow, meaning taking a few seconds to refresh. Suspecting there was some poorly performing SQL behind those pages, we tried to generate a SQL Trace so we could review the generated SQL. Well, there is no out-of-the-box instrumentation to turn SQL Trace ON from an APEX page… Thus our challenge became: How can we identify suspected SQL performing poorly, when such SQL is generated by an APEX page?
Using ASH
Active Session History (ASH) requires an Oracle Diagnostics Pack License. If your site has such a License, and you need to identify poorly performing SQL generated by APEX, you may want to use find_apex.sql script below. It asks for an application user and for the APEX session (a list is provided in both cases). It outputs a list of poorly performing SQL indicating the APEX page of origin, the SQL_ID and the SQL text. With the SQL_ID you can use some other tool in order to gather additional diagnostics details, including the Execution Plan. You may want to use for that: planx.sql, sqlmon.sql or sqlash.sql. Note that find_apex.sql script also references sqld360.sql, but this new tool is not yet available, so use one of the other 3 suggestions for the time being (or SQLHC/SQLT).
To find poorly performing SQL, script find_apex.sql uses ASH instead of SQL Trace. If the action on a page takes more than a second, then most probably ASH will capture the poorly performing SQL delaying the page.
Script
----------------------------------------------------------------------------------------
--
-- File name: find_apex.sql
--
-- Purpose: Finds APEX poorly performing SQL for a given application user and session
--
-- Author: Carlos Sierra
--
-- Version: 2014/09/03
--
-- Usage: Inputs APEX application user and session id, and outputs list of poorly
-- performing SQL statements for further investigation with other tools.
--
-- Example: @find_apex.sql
--
-- Notes: Developed and tested on 11.2.0.3.
--
-- Requires an Oracle Diagnostics Pack License since ASH data is accessed.
--
-- To further investigate poorly performing SQL use sqld360.sql
-- (or planx.sql or sqlmon.sql or sqlash.sql).
--
---------------------------------------------------------------------------------------
--
WHENEVER SQLERROR EXIT SQL.SQLCODE;
ACC confirm_license PROMPT 'Confirm with "Y" that your site has an Oracle Diagnostics Pack License: '
BEGIN
IF NOT '&&confirm_license.' = 'Y' THEN
RAISE_APPLICATION_ERROR(-20000, 'You must have an Oracle Diagnostics Pack License in order to use this script.');
END IF;
END;
/
WHENEVER SQLERROR CONTINUE;
--
COL seconds FOR 999,990;
COL appl_user FOR A30;
COL min_sample_time FOR A25;
COL max_sample_time FOR A25;
COL apex_session_id FOR A25;
COL page FOR A4;
COL sql_text FOR A80;
--
SELECT COUNT(*) seconds,
SUBSTR(client_id, 1, INSTR(client_id, ':') - 1) appl_user,
MIN(sample_time) min_sample_time,
MAX(sample_time) max_sample_time
FROM gv$active_session_history
WHERE module LIKE '%/APEX:APP %'
GROUP BY
SUBSTR(client_id, 1, INSTR(client_id, ':') - 1)
HAVING SUBSTR(client_id, 1, INSTR(client_id, ':') - 1) IS NOT NULL
ORDER BY
1 DESC, 2
/
--
ACC appl_user PROMPT 'Enter application user: ';
--
SELECT MIN(sample_time) min_sample_time,
MAX(sample_time) max_sample_time,
SUBSTR(client_id, INSTR(client_id, ':') + 1) apex_session_id,
COUNT(*) seconds
FROM gv$active_session_history
WHERE module LIKE '%/APEX:APP %'
AND SUBSTR(client_id, 1, INSTR(client_id, ':') - 1) = TRIM('&&appl_user.')
GROUP BY
SUBSTR(client_id, INSTR(client_id, ':') + 1)
ORDER BY
1 DESC
/
--
ACC apex_session_id PROMPT 'Enter APEX session ID: ';
--
SELECT COUNT(*) seconds,
SUBSTR(h.module, INSTR(h.module, ':', 1, 2) + 1) page,
h.sql_id,
SUBSTR(s.sql_text, 1, 80) sql_text
FROM gv$active_session_history h,
gv$sql s
WHERE h.module LIKE '%/APEX:APP %'
AND SUBSTR(h.client_id, 1, INSTR(h.client_id, ':') - 1) = TRIM('&&appl_user.')
AND SUBSTR(h.client_id, INSTR(h.client_id, ':') + 1) = TRIM('&&apex_session_id.')
AND s.sql_id = h.sql_id
AND s.inst_id = h.inst_id
AND s.child_number = h.sql_child_number
GROUP BY
SUBSTR(h.module, INSTR(h.module, ':', 1, 2) + 1),
h.sql_id,
SUBSTR(s.sql_text, 1, 80)
ORDER BY
1 DESC, 2, 3
/
--
PRO Use sqld360.sql (or planx.sql or sqlmon.sql or sqlash.sql) on SQL_ID of interest
Note
This script as well as some others are now available on GitHub.
Free script to generate a Line Chart on HTML
Performance Metrics are easier to digest if visualized trough some Line Charts. OEM, eDB360, eAdam and other tools use them. If you already have a SQL Statement that provides the Performance Metrics you care about, and just need to generate a Line Chart for them, you can easily create a CSV file and open it with MS-Excel. But if you want to build an HTML Report out of your SQL, that is a bit harder, unless you use existing technologies. Tools like eDB360 and eAdam use Google Charts as a mechanism to easily generate such Charts. A peer asked me if we could have such functionality stand-alone, and that challenged me to create and share it.
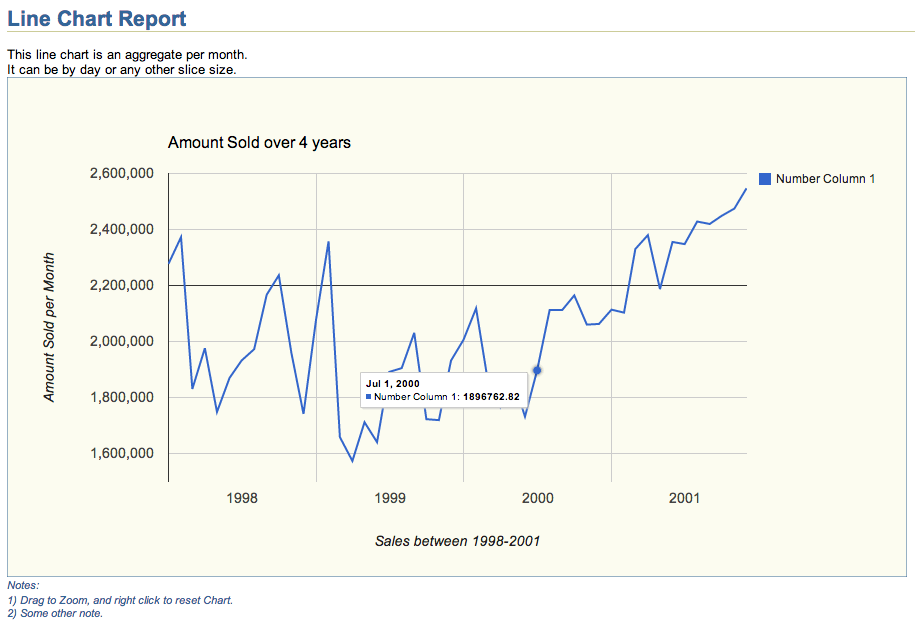
This HTML Line Chart Report above was created with script line_chart.sql shown below. The actual chart, which includes Zoom functionality on HTML can be downloaded from this Dropbox location. Feel free to use this line_chart.sql script as a template to display your Performance Metrics. It can display several series into one Chart (example above shows only one), and by reviewing code below you will find out how easy it is to adjust to your own needs. Chart above was created using a simple query against the Oracle Sample Schema SH, but the actual use could be Performance Metrics or any other Application time series.
Script
SET TERM OFF HEA OFF LIN 32767 NEWP NONE PAGES 0 FEED OFF ECHO OFF VER OFF LONG 32000 LONGC 2000 WRA ON TRIMS ON TRIM ON TI OFF TIMI OFF ARRAY 100 NUM 20 SQLBL ON BLO . RECSEP OFF;
PRO
DEF report_title = "Line Chart Report";
DEF report_abstract_1 = "<br>This line chart is an aggregate per month.";
DEF report_abstract_2 = "<br>It can be by day or any other slice size.";
DEF report_abstract_3 = "";
DEF report_abstract_4 = "";
DEF chart_title = "Amount Sold over 4 years";
DEF xaxis_title = "Sales between 1998-2001";
--DEF vaxis_title = "Amount Sold per Hour";
--DEF vaxis_title = "Amount Sold per Day";
DEF vaxis_title = "Amount Sold per Month";
DEF vaxis_baseline = ", baseline:2200000";
DEF chart_foot_note_1 = "<br>1) Drag to Zoom, and right click to reset Chart.";
DEF chart_foot_note_2 = "<br>2) Some other note.";
DEF chart_foot_note_3 = "";
DEF chart_foot_note_4 = "";
DEF report_foot_note = "This is a sample line chart report.";
PRO
SPO line_chart.html;
PRO <html>
PRO <!-- $Header: line_chart.sql 2014-07-27 carlos.sierra $ -->
PRO <head>
PRO <title>line_chart.html</title>
PRO
PRO <style type="text/css">
PRO body   {font:10pt Arial,Helvetica,Geneva,sans-serif; color:black; background:white;}
PRO h1     {font-size:16pt; font-weight:bold; color:#336699; border-bottom:1px solid #cccc99; margin-top:0pt; margin-bottom:0pt; padding:0px 0px 0px 0px;}
PRO h2     {font-size:14pt; font-weight:bold; color:#336699; margin-top:4pt; margin-bottom:0pt;}
PRO h3     {font-size:12pt; font-weight:bold; color:#336699; margin-top:4pt; margin-bottom:0pt;}
PRO pre    {font:8pt monospace;Monaco,"Courier New",Courier;}
PRO a      {color:#663300;}
PRO table  {font-size:8pt; border_collapse:collapse; empty-cells:show; white-space:nowrap; border:1px solid #cccc99;}
PRO li     {font-size:8pt; color:black; padding-left:4px; padding-right:4px; padding-bottom:2px;}
PRO th     {font-weight:bold; color:white; background:#0066CC; padding-left:4px; padding-right:4px; padding-bottom:2px;}
PRO td     {color:black; background:#fcfcf0; vertical-align:top; border:1px solid #cccc99;}
PRO td.c   {text-align:center;}
PRO font.n {font-size:8pt; font-style:italic; color:#336699;}
PRO font.f {font-size:8pt; color:#999999; border-top:1px solid #cccc99; margin-top:30pt;}
PRO </style>
PRO
PRO <script type="text/javascript" src="https://www.google.com/jsapi"></script>
PRO <script type="text/javascript">
PRO google.load("visualization", "1", {packages:["corechart"]})
PRO google.setOnLoadCallback(drawChart)
PRO
PRO function drawChart() {
PRO var data = google.visualization.arrayToDataTable([
/* add below more columns if needed (modify 3 places) */
PRO ['Date Column', 'Number Column 1']
/****************************************************************************************/
WITH
my_query AS (
/* query below selects one date_column and a small set of number_columns */
SELECT --TRUNC(time_id, 'HH24') date_column /* preserve the column name */
       --TRUNC(time_id, 'DD') date_column /* preserve the column name */
       TRUNC(time_id, 'MM') date_column /* preserve the column name */
       , SUM(amount_sold) number_column_1 /* add below more columns if needed (modify 3 places) */
  FROM sh.sales
 GROUP BY
       --TRUNC(time_id, 'HH24') /* aggregate per hour, but it could be any other */
       --TRUNC(time_id, 'DD') /* aggregate per day, but it could be any other */
       TRUNC(time_id, 'MM') /* aggregate per month, but it could be any other */
/* end of query */
)
/****************************************************************************************/
/* no need to modify the date column below, but you may need to add some number columns */
SELECT ', [new Date('||
       TO_CHAR(q.date_column, 'YYYY')|| /* year */
       ','||(TO_NUMBER(TO_CHAR(q.date_column, 'MM')) - 1)|| /* month - 1 */
       --','||TO_CHAR(q.date_column, 'DD')|| /* day */
       --','||TO_CHAR(q.date_column, 'HH24')|| /* hour */
       --','||TO_CHAR(q.date_column, 'MI')|| /* minute */
       --','||TO_CHAR(q.date_column, 'SS')|| /* second */
       ')'||
       ','||q.number_column_1|| /* add below more columns if needed (modify 3 places) */
       ']'
  FROM my_query q
 ORDER BY
       date_column
/
/****************************************************************************************/
PRO ]);
PRO
PRO var options = {
PRO backgroundColor: {fill: '#fcfcf0', stroke: '#336699', strokeWidth: 1},
PRO explorer: {actions: ['dragToZoom', 'rightClickToReset'], maxZoomIn: 0.1},
PRO title: '&&chart_title.',
PRO titleTextStyle: {fontSize: 16, bold: false},
PRO focusTarget: 'category',
PRO legend: {position: 'right', textStyle: {fontSize: 12}},
PRO tooltip: {textStyle: {fontSize: 10}},
PRO hAxis: {title: '&&xaxis_title.', gridlines: {count: -1}},
PRO vAxis: {title: '&&vaxis_title.' &&vaxis_baseline., gridlines: {count: -1}}
PRO }
PRO
PRO var chart = new google.visualization.LineChart(document.getElementById('chart_div'))
PRO chart.draw(data, options)
PRO }
PRO </script>
PRO </head>
PRO <body>
PRO <h1>&&report_title.</h1>
PRO &&report_abstract_1.
PRO &&report_abstract_2.
PRO &&report_abstract_3.
PRO &&report_abstract_4.
PRO <div id="chart_div" style="width: 900px; height: 500px;"></div>
PRO <font class="n">Notes:</font>
PRO <font class="n">&&chart_foot_note_1.</font>
PRO <font class="n">&&chart_foot_note_2.</font>
PRO <font class="n">&&chart_foot_note_3.</font>
PRO <font class="n">&&chart_foot_note_4.</font>
PRO <pre>
L
PRO </pre>
PRO <br>
PRO <font class="f">&&report_foot_note.</font>
PRO </body>
PRO </html>
SPO OFF;
SET HEA ON LIN 80 NEWP 1 PAGES 14 FEED ON ECHO OFF VER ON LONG 80 LONGC 80 WRA ON TRIMS OFF TRIM OFF TI OFF TIMI OFF ARRAY 15 NUM 10 NUMF "" SQLBL OFF BLO ON RECSEP WR;
Why using SQLTXPLAIN
Every so often I see on a distribution list a posting that starts like this: “I upgraded my application from database release X to release Y and now many queries are performing poorly, can you tell why?”
As everyone else on a distribution list, my first impulse is to make an educated guess permeated by a prior set of experiences. The intentions are always good, but the process is painful and time consuming. Many of us have seen this kind of question, and many of us have good hunches. Still I think our eagerness to help blinds us a bit. The right thing to do is to step back and analyze the facts, and I mean all the diagnostics supporting the observation.
What is needed to diagnose a SQL Tuning issue?
The list is large, but I will enumerate some of the most important pieces:
- SQL Text
- Version of the database (before and after upgrade)
- Database parameters (before and after)
- State of the CBO Statistics (before and after)
- Changes on Histograms
- Basics about the architecture (CPUs, memory, etc.)
- Values of binds if SQL has them
- Indexes compare, including state (visible?, usable?)
- Execution Plan (before and after)
- Plan stability? (Stored Outlines, Profiles, SQL Plan Management)
- Performance history as per evidence on AWR or StatsPack
- Trace from Event 10053 to understand the CBO
- Trace from Event 10046 level 8 or 12 to review Waits
- Active Session History (ASH) if 10046 is not available
I could keep adding bullets to the list, but I think you get the point: There are simply too many things to check! And each takes some time to collect. More important, the state of the system changes overtime, so you may need to re-collect the same diagnostics more than once.
SQLTXPLAIN to the rescue
SQLT or SQLTXPLAIN, has been available on MetaLink (now MOS) under note 215187.1 for over a decade. In short, SQLT collects all the diagnostics listed above and a lot more. That is WHY Oracle Support uses it every day. It simply saves a lot of time! So, I always encourage fellow Oracle users to make use of the FREE tool and expedite their own SQL Tuning analysis. When time permits, I do volunteer to help on an analysis. So, if you get to read this, and you want to help yourself while using SQLT but feel intimidated by this little monster, please give it a try and contact me for assistance. If I can help, I will, if I cannot, I will let you know.
Conclusion
It is fun to guess WHY a SQL is not performing as expected, and trying different guesses is educational but very time consuming. If you want to actually find root causes before trying to fix your SQL, you may want to collect relevant diagnostics. SQLT is there to help, and if installing this tool is not something you can do in a short term, consider then SQL Health-Check SQLHC.
What is new with EDB360?
Many things, but most important is that it got bigger and better. This EDB360 free tool provided is maturing over time. Its core function has not changed although, which is to present a 360-degree view of a database (10g or higher).
EDB360 is a nice complement to other tools like Exacheck, Raccheck or Oracheck. It has some additional benefits, like taking a snapshot of a system to then be analyzed offline or simply to preserve this snapshot as a baseline.
Keep in mind that EDB360 does not install anything on the database, nor it changes any data on it. In some cases, where direct access to the database server is not an option, having the capability of executing EDB360 through a SQL*Plus client connection is a big plus.
I use EDB360 as a starting place to perform a whole database health-check.
Since pictures tell more than words, please find below 4. The first two are about the new entries on EDB360 main menu (menu is a tad bigger than what you see in these two pictures, and its content is dynamic). The last two pictures are just a sample of the charts that are now part of EDB360.
EDB360 execution parameters changed from 4 to 6:
- Oracle Pack License: If your site has the Tuning Pack, then enter ‘T’, else if your site has the Diagnostics Pack enter ‘D’, else enter ‘N’.
- Days of History to consider. If you entered ‘T’ or ‘D’ on first parameter, then specify on 2nd parameter up to how many days of history you want EDB360 to use. By default it uses 31, assuming your AWR history is at least that big.
- Do you want HTML Reports? By default it is ‘Y’.
- Do you want Text Reports? Defaults to ‘Y’.
- Do you want CSV Files? Defaults to ‘Y’.
- Do you want Charts? Defaults to ‘Y’.
Once you login into SQL*Plus while on top of the edb360 directory, simply execute script edb360.sql and pass all 6 parameters one by one or all of them inline. For example: @edb360 T 31 Y Y Y Y
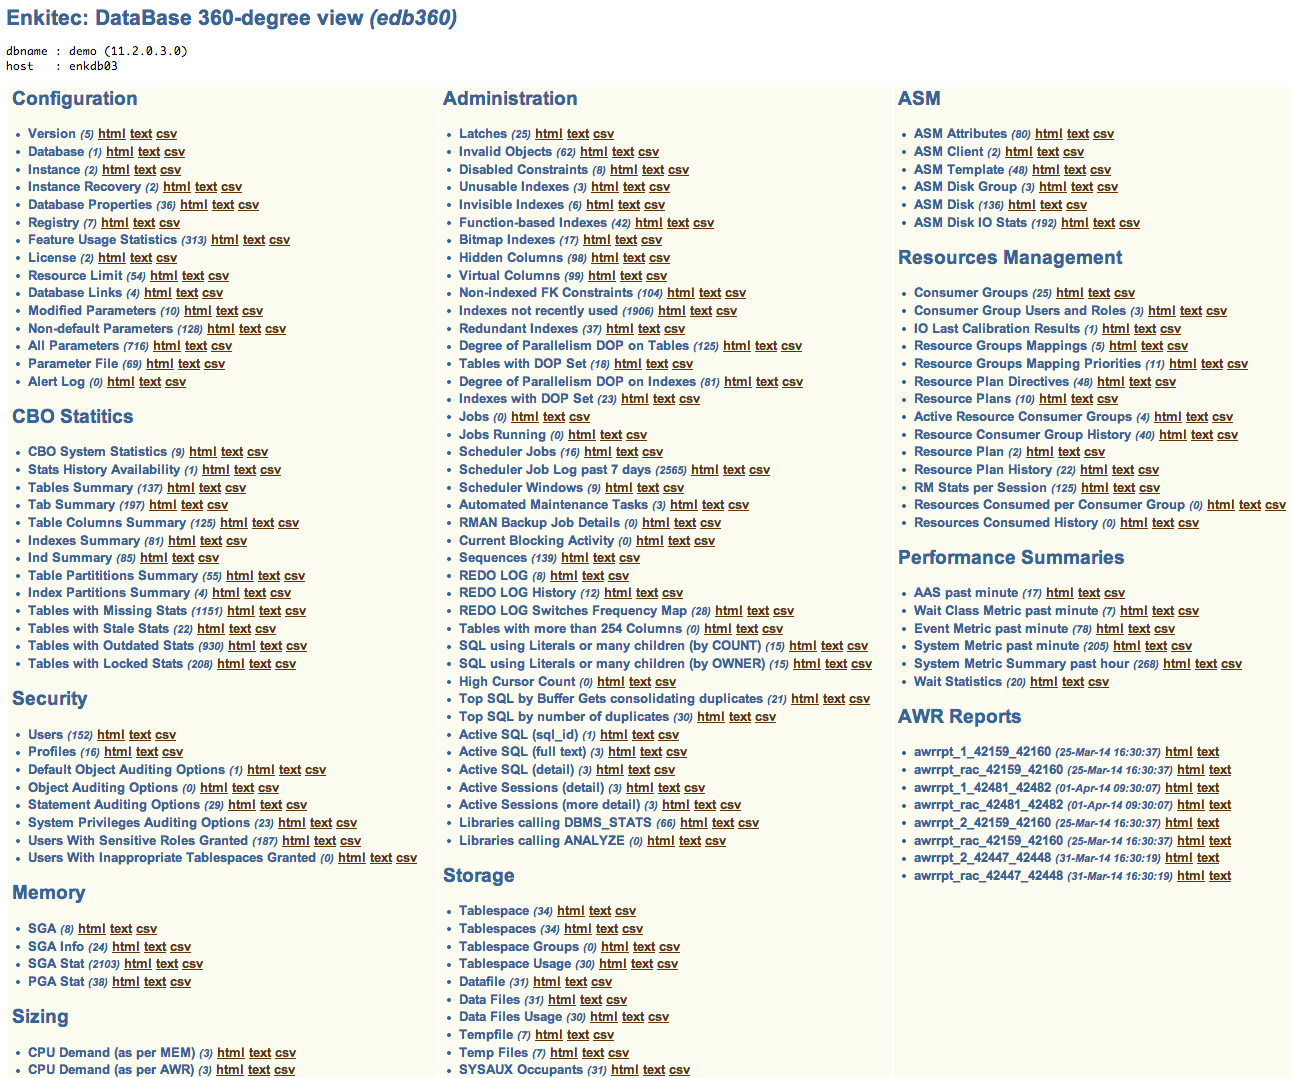
EDB360 Dynamic Menu (part 1)
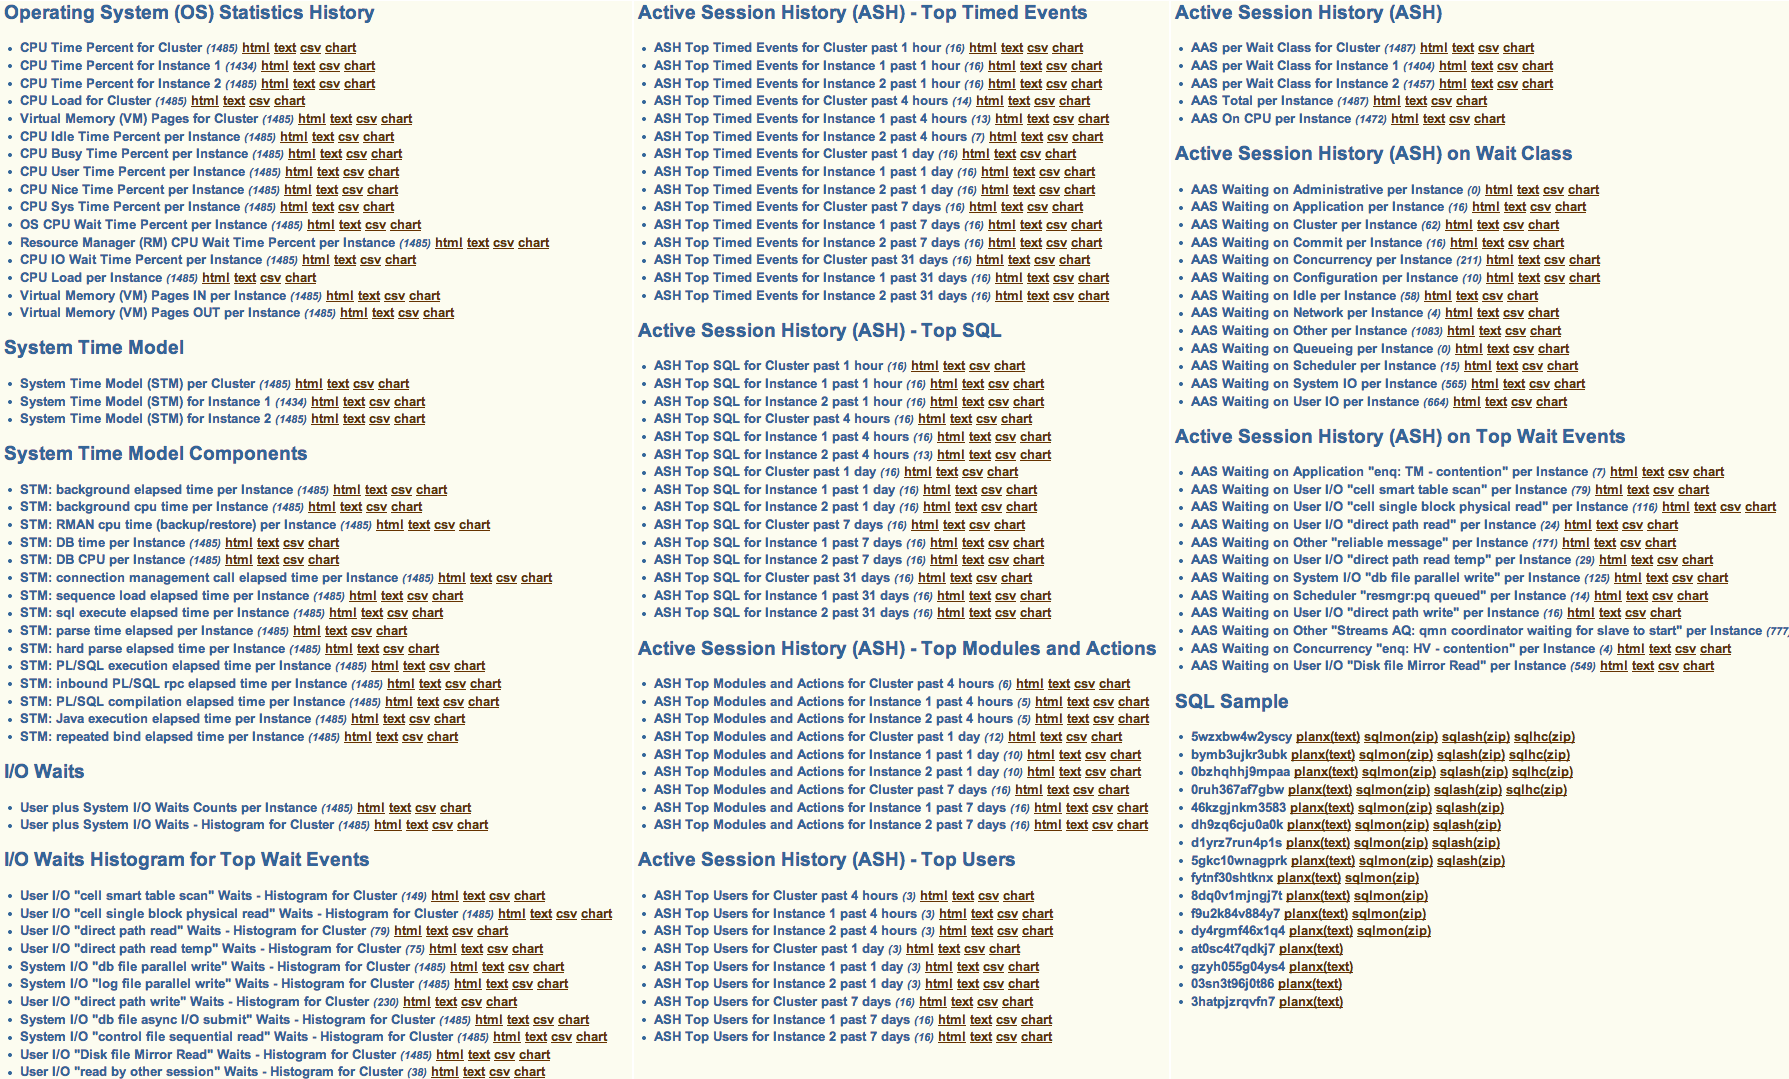
EDB360 Dynamic Menu (part 2)
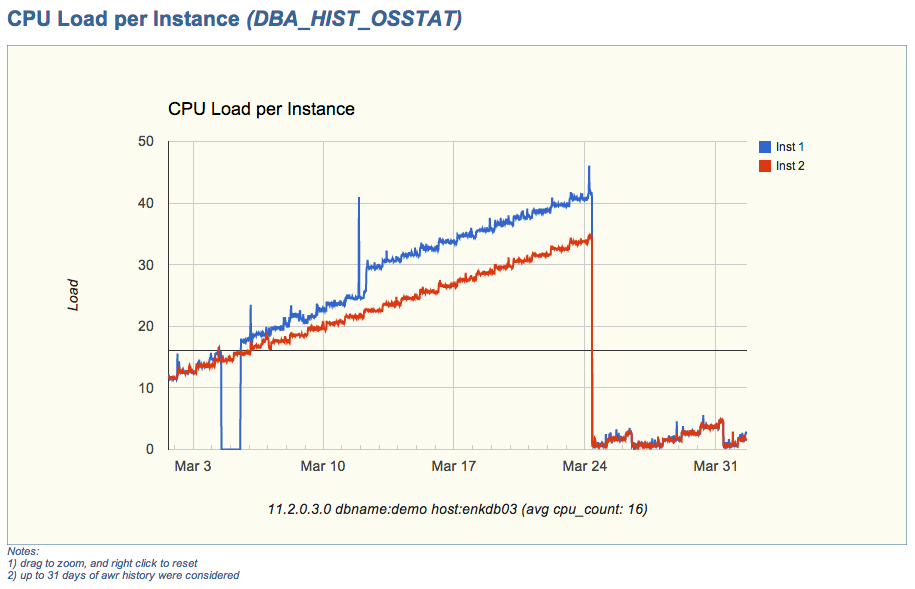
CPU Load per Instance (sample chart)
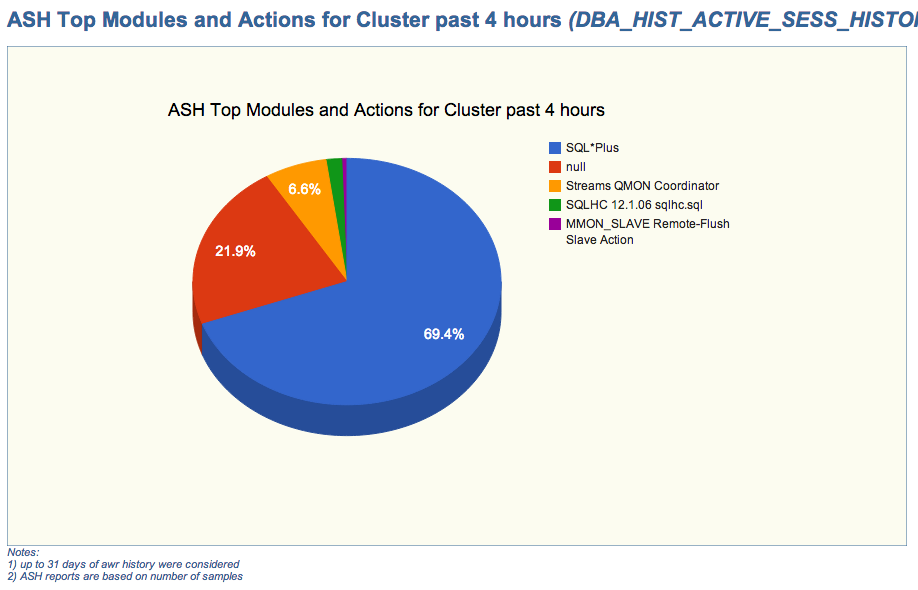
ASH Top Modules and Actions for Cluster (sample chart)
If you have downloaded EDB360 before, then I encourage you to download and test the new version. If you have never used it, I hope you find this tool useful.
Meet: eAdam – Enkitec’s free AWR data mining tool
You recently learned about eDB360, and now eAdam? What is this eAdam tool? Before you continue reading, please be aware that eAdam reads data from AWR, thus you must have a license for the Oracle Diagnostics Pack in order to use this new eAdam tool.
Introduction
New eAdam is a free tool to perform data mining on performance related historical data recorded by AWR. The main characteristics of eAdam are:
- Installs nothing on the Source database (usually Production)
- Extracts AWR performance related data as plain text flat files (no export or data pump binary files)
- Upload extracted AWR data into a Staging database of same or different platform and release
- Data mining is performed on the Staging database instead of Production
How does eAdam work?
It is better to explain eAdam by functions. So I would say eAdam has the following 4 modules:
- AWR extraction from Source (Production)
- eAdam installation on Staging system
- Loading into eAdam Stage a set of AWR files extracted from Source
- AWR data mining on eAdam Stage
AWR extraction from Source (Production)
This is the simplest part. You just need to execute a simple and short script on a Source system (usually Production). This script extracts into flat files the content of the following AWR views. Then it compresses them into a TAR file. List below may expand over time as new eAdam versions become available.
DBA_HIST_ACTIVE_SESS_HISTORY
DBA_HIST_DATABASE_INSTANCE
DBA_HIST_DATAFILE
DBA_HIST_DLM_MISC
DBA_HIST_EVENT_HISTOGRAM
DBA_HIST_FILESTATXS
DBA_HIST_IOSTAT_DETAIL
DBA_HIST_IOSTAT_FILETYPE
DBA_HIST_IOSTAT_FUNCTION
DBA_HIST_OSSTAT
DBA_HIST_PGASTAT
DBA_HIST_SERVICE_STAT
DBA_HIST_SGA
DBA_HIST_SGASTAT
DBA_HIST_SNAPSHOT
DBA_HIST_SQL_PLAN
DBA_HIST_SQLSTAT
DBA_HIST_SQLTEXT
DBA_HIST_SYS_TIME_MODEL
DBA_HIST_SYSSTAT
DBA_HIST_SYSTEM_EVENT
DBA_HIST_TEMPFILE
DBA_HIST_TEMPSTATXS
eAdam installation on Staging system
You install eAdam once and then use it multiple times. If you download a newer version just install it on top of the prior one, so you get the eAdam delta. eAdam should be installed on a Staging database and not in Production or UAT. Pretty much any database could be your Staging database (QA or any other lower environment). It could even be a database on your laptop for example. Your Staging database does not have to be the same platform or database release than Source.
To install eAdam you simply execute another script. It creates a schema (you provide the name and password), and this script creates the eAdam repository on your Staging database.
Loading into eAdam Stage a set of AWR files extracted from Source
You can load into eAdam as many TAR files as you want. Each set is identified within eAdam with a sequence key. So your eAdam repository can contain AWR data from different systems, and they could be from same or different platforms and database releases. The data model of your eAdam repository is determined from your Staging database release, so it is ideal your Staging database is of equal or higher release than your Sources, but this is not mandatory.
To load a TAR file with AWR data into your Staging eAdam repository, you execute another script that asks for the TAR name and it produces a set of External Tables, then uploads the AWR data from the temporary external Tables into permanent staging Tables:
DBA_HIST_ACTIVE_SESS_HIST_S
DBA_HIST_DATABASE_INSTANC_S
DBA_HIST_DATAFILE_S
DBA_HIST_DLM_MISC_S
DBA_HIST_EVENT_HISTOGRAM_S
DBA_HIST_FILESTATXS_S
DBA_HIST_IOSTAT_DETAIL_S
DBA_HIST_IOSTAT_FILETYPE_S
DBA_HIST_IOSTAT_FUNCTION_S
DBA_HIST_OSSTAT_S
DBA_HIST_PGASTAT_S
DBA_HIST_SERVICE_STAT_S
DBA_HIST_SGASTAT_S
DBA_HIST_SGA_S
DBA_HIST_SNAPSHOT_S
DBA_HIST_SQLSTAT_S
DBA_HIST_SQLTEXT_S
DBA_HIST_SQL_PLAN_S
DBA_HIST_SYSSTAT_S
DBA_HIST_SYSTEM_EVENT_S
DBA_HIST_SYS_TIME_MODEL_S
DBA_HIST_TEMPFILE_S
DBA_HIST_TEMPSTATXS_S
DBA_HIST_XTR_CONTROL_S
DBA_TAB_COLUMNS_S
AWR Data mining on eAdam Stage
Once your AWR is available inside eAdam, you can perform all the Data Mining you may need. A sample script that produces several CSV files out of your data is provided. This sample script is automatically executed at the end of your upload, so you get a set of CSV files that can be used on Excel or any other tool that reads CSV files. I use Excel, where I can easily generate Charts out of the CSV files created by the sample script. That means I can easily visualize trends out of performance data without having access to the Source (Production) environment.
To produce the sample CSV files, eAdam provides a set of views on top of its own repository. These set of views will evolve over time as new releases become available. As of 1st release we provide the following views:
SH_AAS_APPLICATION_V1
ASH_AAS_CLUSTER_V1
ASH_AAS_COMMIT_V1
ASH_AAS_CONCURRENCY_V1
ASH_AAS_ON_CPU_V1
ASH_AAS_OTHER_V1
ASH_AAS_SCHEDULER_V1
ASH_AAS_TOTAL_V1
ASH_AAS_USER_IO_V1
ASH_INST_V1
ASH_RAC_V1
EVENT_HISTOGRAM_INST_V1
EVENT_HISTOGRAM_IO_RAC_V1
EVENT_HISTOGRAM_RAC_V1
EVENT_HISTOGRAM_RAC_V2
OSSTAT_BUSY_TIME_PERC_V1
OSSTAT_DELTA_V1
OSSTAT_INST_V1
OSSTAT_LOAD_V1
OSSTAT_RAC_V1
SYSTEM_EVENT_DELTA_V1
SYSTEM_EVENT_INST_V1
SYSTEM_EVENT_NON_IDLE_V1
SYSTEM_EVENT_RAC_V1
SYS_TIME_MODEL_DB_CPU_V3
SYS_TIME_MODEL_DB_TIME_V3
SYS_TIME_MODEL_DB_WAIT_V3
SYS_TIME_MODEL_DELTA_V1
SYS_TIME_MODEL_INST_V1
SYS_TIME_MODEL_RAC_V1
FAQ
Q1: Where can I download eAdam?
A1: From the Enkitec web page. Click on the “Products” tab. The tool will be available on March 7, 2014.
Q2: Is it really free?
A2: Yes. And before you ask what is the catch: “there is no catch”. Just be aware you must have an Oracle Diagnostics Pack license in order to access AWR data, and this eAdam tool is not an exception. Besides that, eAdam is free to download and use.
Q3: I need some extra functionality. How do I get it?
A3: If you need something that eAdam does not provide out of the box, of course you can extend its functionality directly. If the addition is something of general interest, you can submit an “Enhancement Request” (an email actually or a comment on this post). But it you want something more advanced and of particular use, you can contact Enkitec for a quote for this customization on top of eAdam (for example an Apex application).
Q4: Can I share this eAdam tool or its output?
A4: Sure you can. Just credit Enkitec for the tool. In other words, use it any way you want, but please honor authorship and ownership.
Q5: Who “owns” eAdam?
A5: Enkitec owns this new tool. Carlos Sierra is the author of eAdam, but the vision and some critical components were provided by: Frits Hoogland, Karl Arao and Randy Johnson. So eAdam is the product of a collaboration effort of some geeks working for Enkitec.
Conclusion
Enkitec is providing this eAdam tool for AWR Data Mining for free. Having an Oracle Diagnostics Pack is a must before using this tool. Besides that, feel free to use this tool at will, and perform all your AWR Data Mining outside the Source system, which is very important for a Production environment. This eAdam is very resource conscious on the Source system, and it empowers anyone to do performance analysis without having direct access to the Source database.
Having an AWR repository created with eAdam, enables many possibilities, like having baselines for particular processes, or compare performance between different time intervals (pre and post an application upgrade for example) or between two different systems (UAT and Production for example). If you already have a set of scripts to do data mining on DBA_HIST views, you can easily convert them to use the matching eAdam Staging tables so you would no longer be constrained to connect to the live system.
Performing Data Mining in entities like ASH as stored by AWR is like digging in a gold mine. There is so much the database wants to tell you. You just need this kind of of tool to listen carefully and find what is important.
Meet “edb360”: a free tool that provides a 360-degree view of an Oracle database
Simply put: edb360 is a new free tool that provides a 360-degree view of an Oracle database.
What is “edb360“?
This “edb360” tool is the product of a collaborative effort of some very smart guys, and me. Special thanks to Frits Hoogland, Karl Arao, Randy Johnson, Martin Bach, Kyle Hailey, Tanel Poder, Alex Fatkulin, Mauro Pagano, Abel Macias, Jon Adams and Jack Agustin. These guys helped me to envision edb360, some directly and some indirectly, but their help and shared knowledge motivated me to develop edb360 and make it available today.
The edb360 tool started as a quick and dirty “script” to gather basic information about a database without knowing anything about it before hand. The first rule for edb360 was: it has to install nothing in the database. The second rule became: it has to provide some insight about a database.
The output is presented for the most part into 3 formats: HTML, Text and Comma-separated Values (CSV). Why? HTML and Text can be easily used to consolidate important findings into a Word report. Sometimes HTML is more useful and sometimes Text is better. Then CSV is used to produce charts out of Performance Trends. Some people can visualize trends easier with a graph (me included).
What about other tools?
Of course there are wonderful tools that can help in this arena, like Oracle Enterprise Manager (OEM) or Oracle’s Automatic Workload Repository (AWR). So why not using those tools? Well, if I had access to OEM or I knew before hand which time intervals I want to analyze with AWR, then I would not have a strong need to use edb360. The reality that we consultants face when we are getting acquainted of a system, is that we are not given any access to the database of interest (usually production). And asking for a server account feels like asking for coke’s secret formula: then we simply cannot poke the database at our own will, and that is understandable. So, what is our second best?: please run this script that installs nothing and generates a zip file with some metadata from your system. The script is plain text and its output is also plain text (html, text and csv files). So, any DBA or System Administration can validate that no customer confidential data is extracted or exposed. A win-win!
If the system we want to understand is an Exadata system, we can also request for an Exacheck output, if not an Exadata system but a RAC cluster, there is Raccheck. These two tools, available though My Oracle Support (MOS) make a good companion for the edb360. In other words, edb360 is not a replacement for the other two but more of an add-on or companion.
Why is edb360 free?
Why not? Often I get asked: why do you give away the tools and scripts you develop? The answer is simple: tools, scripts, white papers, blog entries like this, in my mind they all represent the same: sharing knowledge with our Oracle community. I wish for a community where knowledge (and tools) flows for all to benefit. Let’s say my personal time I invest building tools and scripts kinds of make it up for my lame blog postings. 😉
What is the catch?
No catch. Just be aware that edb360 makes use of some DBA_HIST views and ASH data, and those are part of the Oracle Diagnostics Pack. So when executing the tool it will ask to indicate if your site has those licenses. Your answer determines the scope of the output. So if you specify you have a license for the Oracle Diagnostics Pack then your edb360 output includes pieces from AWR and ASH, else AWR and ASH are not accessed.
About versions, feedback and support
For the most part, I am committed to maintain this tool as my personal time permits. That means I can only work on it during odd hours and not every day. Nothing different than SQLTXPLAIN during the first few years of its existence, so I am not scared. Keep also in mind this edb360 is work in progress, and version v1405 is the first one I feel comfortable sharing with the community. In other words, it is far from perfect and I foresee it growing in multiple directions.
If you like this tool, and want to enhance its output, get SQLHC from MOS 1366133.1, and place the sqlhc.sql script into the same db360/sql directory. By doing so, you will also get 3 SQL health-checks. In other words, edb360 is SQLHC aware.
Conclusion
If you like free tools and have a use for this edb360 tool, you might as well download it and give it a shot. Nothing to lose (besides a few minutes of your spare time). A sample output is also available under same link above.
Life is Good!
SQL Monitor and SQL ASH Scripts are now available
I just uploaded two new scripts to my set of “Shared Scripts“. These are the sqlmon.sql and the sqlash.sql. They both input a SQL_ID and produce some txt/html/zip output.
The sqlmon.sql produces SQL Monitor Reports for all executions available on SQL Monitor for a given SQL. It is RAC aware and its output includes both text and “active” reports. You must have an Oracle Tuning Pack license on the system where you may want to use it.
The sqlash.sql produces Active Session History (ASH) Reports for one SQL_ID. It is also RAC aware and output includes both text and html formats. It produces these ASH reports from both memory and AWR. You must have an Oracle Diagnostics Pack license on the system where you may want to use it.
These two scripts are light weight. Install nothing, change nothing. If you need a more robust diagnostic tool in these areas, please use SQLHC and/or SQLT. In the other hand, for a quick understanding of one SQL you may want to use the trio: planx.sql, sqlash.sql and sqlmon.sql.
