SQL Stats Analytics (from SQL*Plus!)
If you have access to some other graphical tool that displays time series on multiple dimensions for one or a set of SQL statements from an Oracle database, then you may not need “SQL Stats Analytics”. In the other hand, if you have no such tool, or even more restricting, if you can only access your Oracle database through some client connection such as SQL*Plus, then you may have some use for the open-source “SQL Stats Analytics” presented here.
Before you go on, a fair warning: this open-source tool reads DBA_HIST_SQLSTAT, therefore it assumes you are licensed to use the Oracle Diagnostics Pack, like when you access any DBA_HIST view. And a second caveat, this tool has been developed and tested on Oracle databases 12.2 and 19c, so it won’t work on older releases. Final note here: SQL Stats Analytics is part of the “CS Scripts” Tool Set (open-source), then you can use any of these scripts “as is”, but they are not actually supported by me or anyone else (they do work although). Feel free to use this part, or any other part of the “CS Scripts” Tool Kit at your own risk, and with the condition that you cannot claim authorship or ownership.
SQL Stats Analytics, similar to the “Poor-man’s version of ASH Analytics” presented on this blog, is a tool to generate, out of a simple SQL*Plus connection (either from a DB server or from a client machine: i.e.: a Term on a Mac or PC), a Chart that provide valuable insights on performance history and patterns, on one or multiple SQL statements of interest. Since a picture is worth a thousand words, I’d rather show some pictures, then explain briefly this tool.
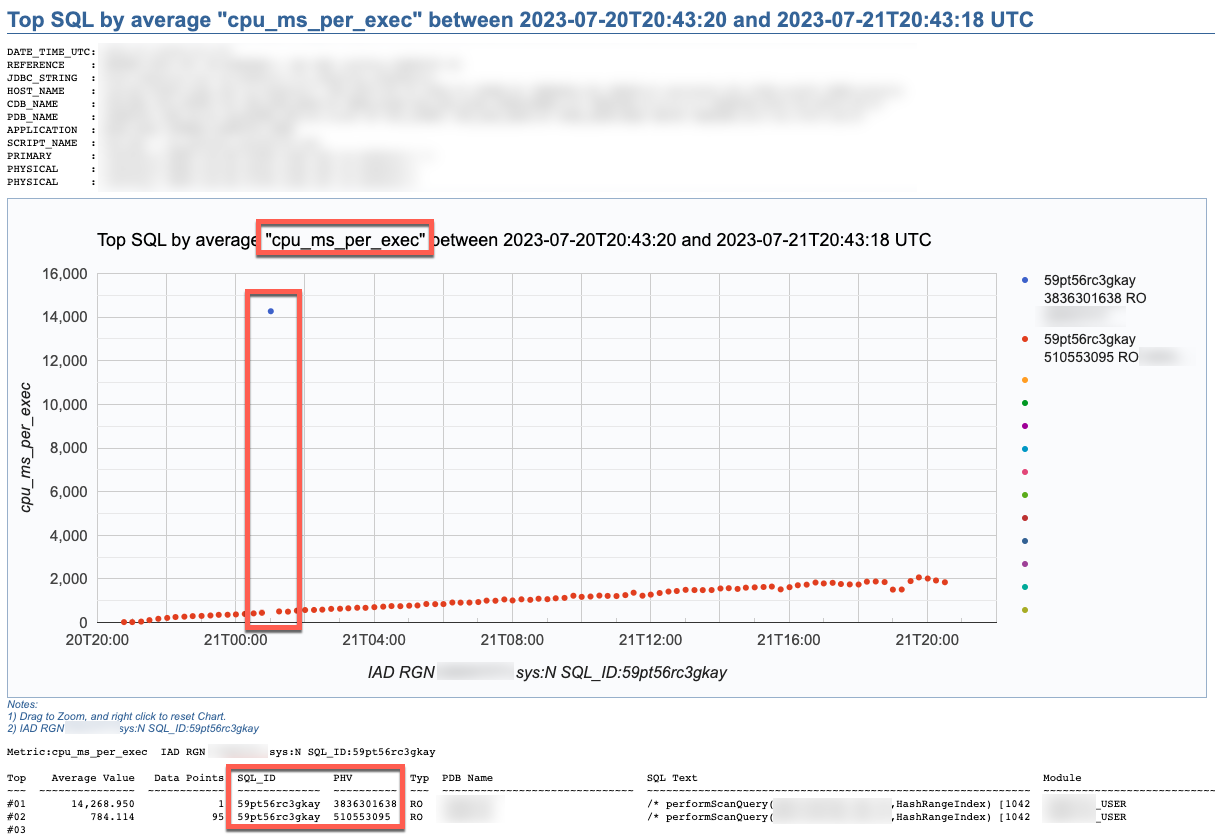

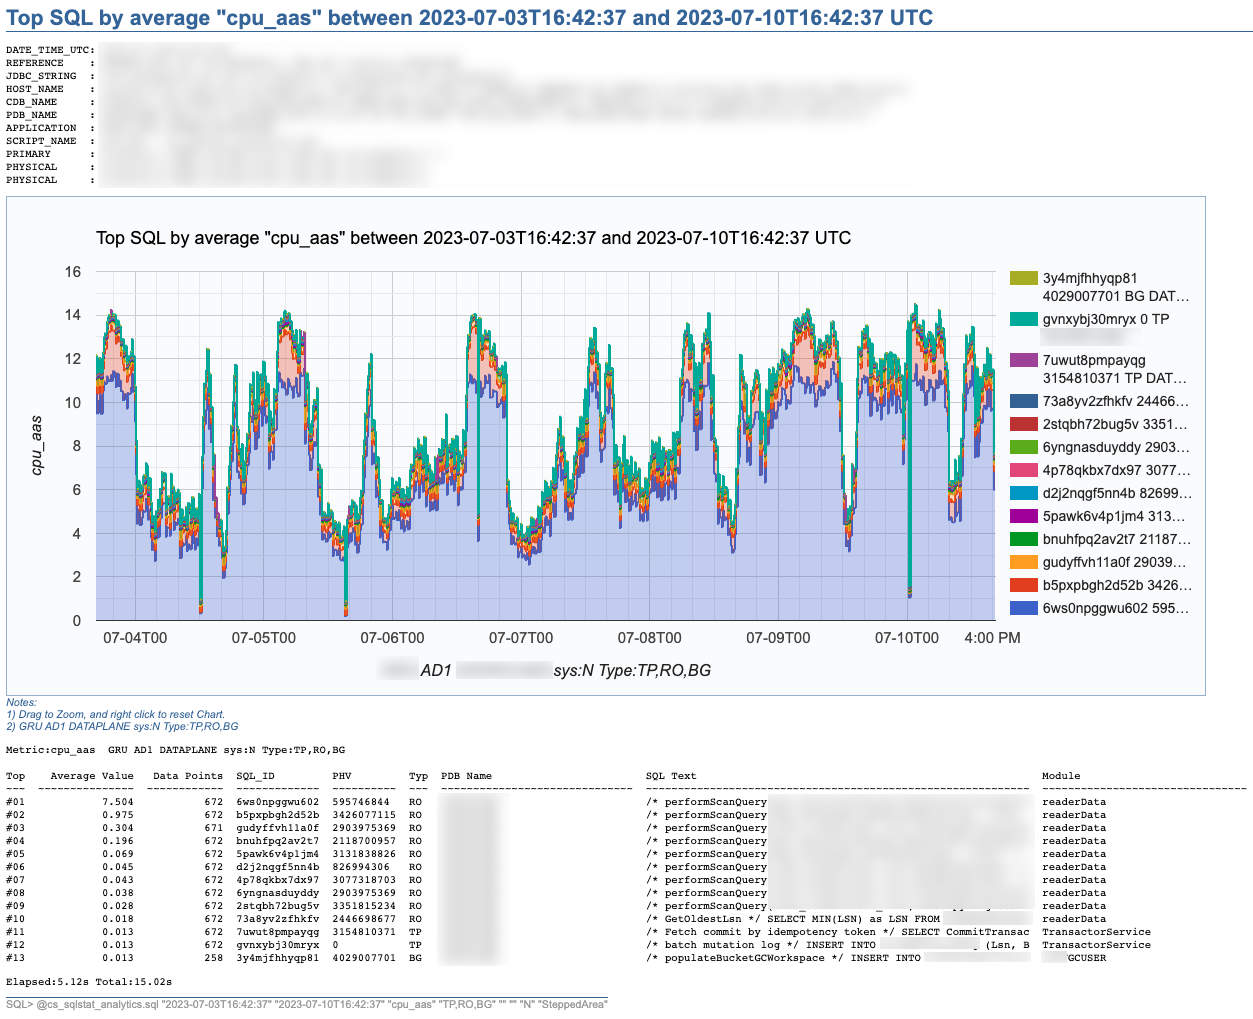
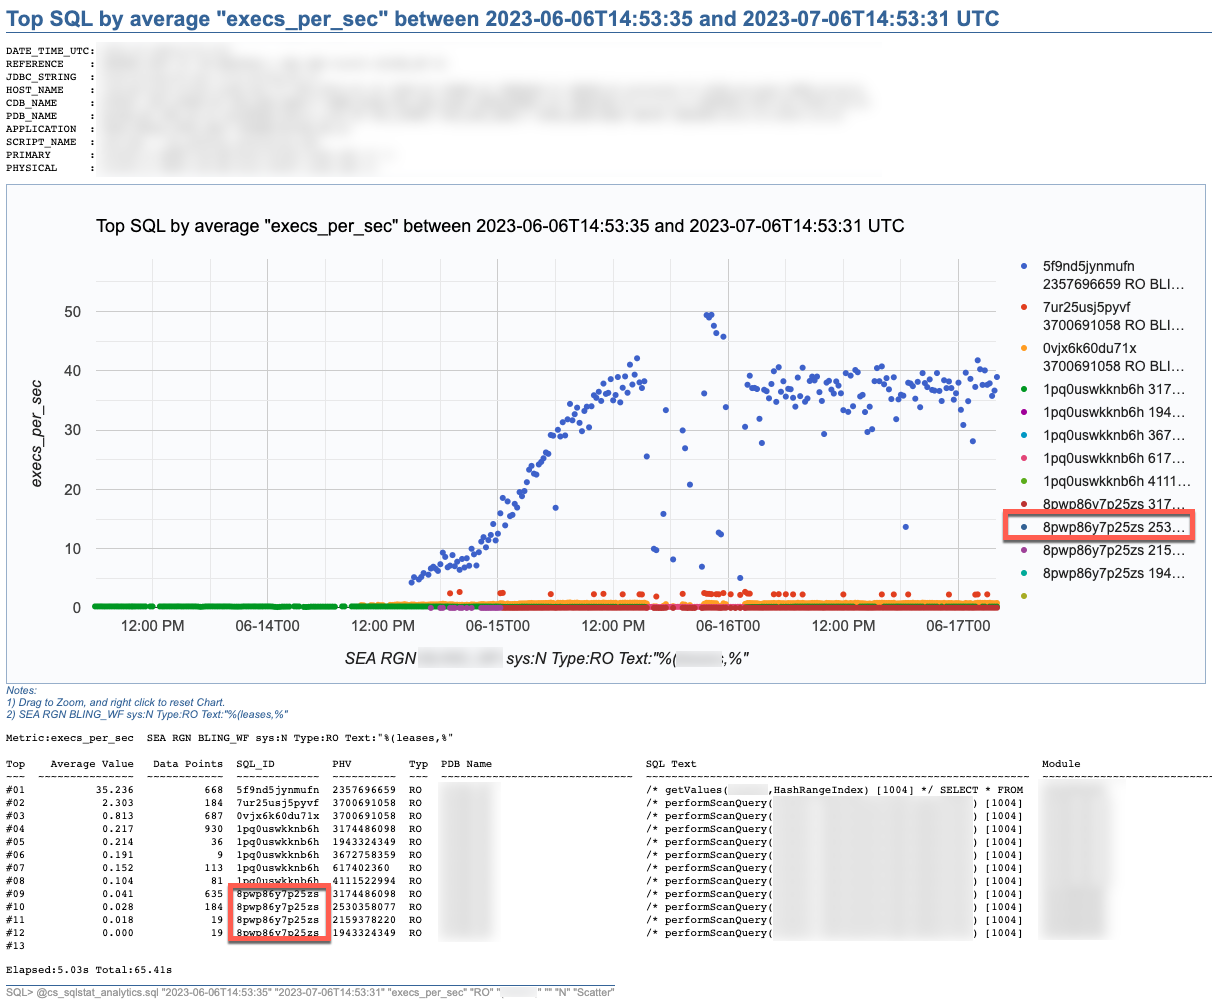
SQL Stats Analytics reads mainly DBA_HIST_SQLSTAT, performs some aggregations to compute multiple SQL statistics, selects the “top” SQL_ID/PLAN_HASH_VALUE pairs as per one selected Statistic, and produces some free Google chart, writing it into a text file to your local SQL*Plus directory where you started SQL*Plus (either on your Term client such as Mac/PC, or your DB server). The generated text file contains plain html, thus it can be opened using any browser. The chart allows some useful zooming on it.
On the “CS Scripts” README.md, you can find this SQL Statistics Analytics as well as its siblings (below). If you want to know what else is there on the “CS Scripts” Tool Set, simply navigate the readme. I do use many of these scripts on a daily basis, and I upload a fresh version to GitHub every so often.

These days I no longer consume SQLT, and I rarely use eDB360 or SQLdb360, since the “CS Scripts” Tool Set gives me everything I need on a piece-by-piece as-needed basis.
The SQL Stats Analytics takes the following input parameters:
- Time From (default to last 7 days)
- Time To (default to now)
- SQL Statistic (exhaustive list of 74 options where most common are: et_ms_per_exec default, et_aas, execs_per_sec, gets_per_exec and rows_per_exec)
- SQL Type (optional SQL categorization, but you may want to just skip this parameter)
- SQL Text piece (optional and case insensitive)
- SQL_ID (optional)
- Include SYS SQL (default to N)
- Graph Type (Scatter default, Line, SteppedArea and Area)
When using the “SQL Text piece” parameter you can focus on a set of SQL statements on a particular application Table, or maybe a SQL predicate of interest. The range of time is limited to your AWR retention (we keep 60 days of history and 15 minutes granularity since defaults of 8 days and 1 hour are not enough for our needs).
If you like this SQL Statistics Analytics script, you may also like the CS Ash Analytics. The former focuses on SQL Performance out of V$SQLSTATS while the latter on SQL Load out of V$ACTIVE_SESSION_HISTORY (and their DBA_HIST views).
Before using any of the CS Scripts, just be sure you are licensed on the Oracle Diagnostics Pack. Be also aware some scripts also use functionality covered under the Oracle Tuning Pack. And as with any other script you download from the internet, please read-proof it entirely and validate its proper use on your site.
Hope you get to enjoy the “CS Scripts” Tool Set!

Thank you for sharing your knowledge with the Oracle DBA community. If possible, please share a procedure and/or examples on how to execute these scripts. Thank You
Ravin Maharaj
July 31, 2023 at 8:02 am
Go to sqlplus and execute desired script.
Carlos Sierra
July 31, 2023 at 11:50 am
Thank you for your prompt response. Please advise what input is required here :
Reference: [{NULL}|DBPERF-nnnnn|IOD-nnnnn|NOC-nnnnn|PROJECT-nnnnn]
Enter value for cs_reference:
Please also share what other inputs are required when prompted
Thank You
Ravin Maharaj
August 2, 2023 at 6:25 am
Hi carlos. these are great scripts. Thanks for your contribution to the oracle community. Just one suggestion , it would be great. if you could have provided the script name before each of the charts.
Mahesh Padhmanabhan
August 2, 2023 at 2:55 am
The script name is cs_sqlstat_analytics.sql as shown on readme snapshot. Same script for all charts on post.
Carlos Sierra
August 2, 2023 at 11:59 am
No input is needed. That “reference” is simply to add some text into report heading. For other prompts such as SQL_ID, you have the option to pass a value (if you see the parameter is optional) or to supply some valid value.
Carlos Sierra
August 2, 2023 at 11:57 am