ASH Analytics from SQL*Plus
I used to like (Average Active Session History) ASH Analytics available trough Oracle Enterprise Manager (OEM). Then OEM was not always available, or the time to reach it was too long, or its access too cumbersome at best. Slowly for surely, I started using (and developing) stand-alone scripts to get what I needed from ASH in a timely manner.
Many Developers and even DBAs have access to an Oracle database through SQL*Plus, but not to OEM or any other GUI to check on database performance. And in many cases, access is only available through a client machine (i.e. your Mac or PC), but never to the actual database server directly.
If your site has an Oracle Diagnostics Pack License (i.e. you are authorized to access AWR and ASH data), then you can query your ASH data through SQL*Plus and generate some text-based reports. But, if you’d rather do your analysis visualizing your performance data through time-based charts, you could use tools such as SQLdb360, or some stand-alone scripts that execute on SQL*Plus (client or server-side) and produce charts like the one below. Note that such tools and scripts query AWR and ASH data.
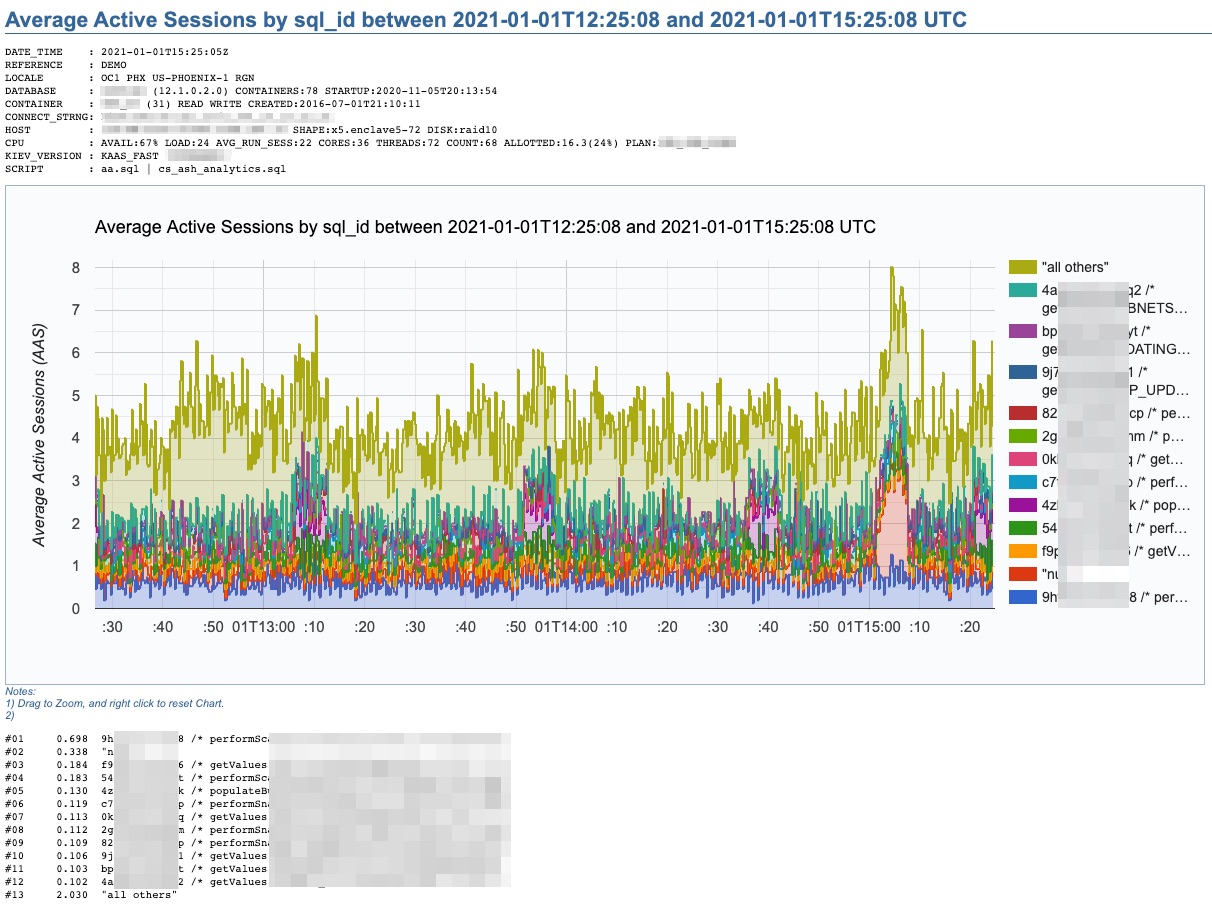
This chart above was produced by what I call “a poor’s man ASH analytics”. It gives me what I need in order to make an initial performance assessment in just a few minutes. It also allows me to properly document cases. This script cs_ash_analytics.sql is part of a subset of the “CS scripts“, available to download and use “as is” for free. Just be aware that many of these scripts should only be used if your site has a License for the Oracle Diagnostics or Tuning Packs. I use the “CS scripts” on a daily basis. And I update them every so often.
This one “ASH analytics” script, when executed from SQL*Plus, allows you to generate a time-based chart on recent (V$) or more persistent (DBA_HIST) ASH data. It provides for diverse dimension options such as: Wait Class, Event, Machine, SQL_ID, Plan Hash Value, Top Level SQL_ID, Blocking Session, Current Obj#, Module or PDB Name. Scope can be filtered by Session State, Wait Class, Event, Machine, SQL Text or SQL_ID. Time window can span a few minutes, hours or days. Time granularity can be specified or let it default as per time window size.
The beauty of this cs_ash_analytics.sql script is that it runs in seconds, produces a nice Google chart, it executes from SQL*Plus, and the script itself is free to download and use (always validate first your site has a proper Oracle Pack License).

Reblogged this on EasyOraDBA | Shadab Mohammad.
easyoradba
January 5, 2021 at 4:59 pm