Archive for the ‘SQL Monitor’ Category
Scripts to deal with SQL Plan Baselines, SQL Profiles and SQL Patches
To mitigate SQL performance issues, I do make use of SQL Plan Baselines, SQL Profiles and SQL Patches, on a daily basis. Our environments are single-instance 12.1.0.2 CDBs, with over 2,000 PDBs. Our goal is Execution Plan Stability and consistent performance, over CBO plan flexibility. The CBO does a good job, considering the complexity imposed by current applications design. Nevertheless, some SQL require some help in order to enhance their plan stability.
I have written and shared a set of scripts that simply make the use of a bunch of APIs a lot easier, with better documented actions, and fully consistent within the organization. I have shared with the community these scripts in the past, and I keep them updated as per needs change. All these “CS” scripts are available under the download section on the right column.
Current version of the CS scripts is more like a toolset. You treat them as a whole. All of them call some other script that exists within the cs_internal subdirectory, then I usually navigate to the parent sql directory, and connect into SQL*Plus from there. All these scripts can be easily cloned and/or customized to your specific needs. They are available as “free to use” and “as is”. There is no requirement to keep their heading intact, so you can reverse-engineer them and make them your own if you want. Just keep in mind that I maintain, enhance, and extend this CS toolset every single day; so what you get today is a subset of what you will get tomorrow. If you think an enhancement you need (or a fix) is beneficial to the larger community (and to you), please let me know.
SQL Plan Baselines scripts

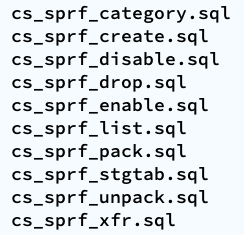
With the set of SQL Plan Baselines scripts, you can: 1) create a baseline based on a cursor or a plan stored into AWR; 2) enable and disable baselines; 3) drop baselines; 4) store them into a local staging table; 5) restore them from their local staging table; 6) promote as “fixed” or demote from “fixed”; 7) “zap” them if you have installed “El Zapper” (iod_spm).
Note: “El Zapper” is a PL/SQL package that extends the functionality of SQL Plan Management by automagically creating SQL Plan Baselines based on proven performance of a SQL statement over time, while considering a large number of executions, and a variety of historical plans. Please do not confuse “El Zapper” with auto-evolve of SPM. They are based on two very distinct premises. “El Zapper” also monitors the performance of active SQL Plan Baselines, and during an observation window it may disable a SQL Plan Baseline, if such plan no longer performs as “promised” (according to some thresholds). Most applications do not need “El Zapper”, since the use of SQL Plan Management should be more of an exception than a rule.
SQL Profiles scripts
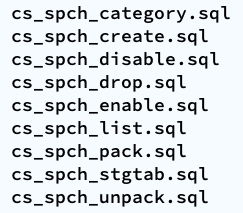
With the set of SQL Profiles scripts, you can: 1) create a profile based on the outline of a cursor, or from a plan stored into AWR; 2) enable and disable profiles; 3) drop profiles; 4) store them into a local staging table; 5) restore them from their local staging table; 6) transfer them from one location to another (very similar to coe_xfr_sql_profile.sql, but on a more modular way).
Note: Regarding the transfer of a SQL Profile, the concept is simple: 1) on source location generate two plain text scripts, one that contains the SQL text, and a second that includes the Execution Plan (outline); 2) execute these two scripts on a target location, in order to create a SQL Profile there. The beauty of this method is not only that you can easily move Execution Plans between locations, but that you can actually create a SQL Profile getting the SQL Text from SQL_ID “A”, and the Execution Plan from SQL_ID “B”, allowing you to do things like: removing CBO Hints, or using a plan from a similar SQL but not quite the same (e.g. I can tweak a stand-alone cloned version of a SQL statement, and once I get the plan that I need, I associate the SQL Text from the original SQL, with the desired Execution Plan out of the stand-alone customized version of the SQL, after that I create a SQL Plan Baseline and drop the staging SQL Profile).
SQL Patches scripts
With the set of SQL Patches scripts, you can: 1) create a SQL patch based on one or more CBO Hints you provide (e.g.: GATHER_PLAN_STATISTICS MONITOR FIRST_ROWS(1) OPT_PARAM(‘_fix_control’ ‘5922070:OFF’) NO_BIND_AWARE); 2) enable and disable SQL patches; 3) drop SQL patches; 4) store them into a local staging table; 5) restore them from their local staging table.
Note: I use SQL Patches a lot, specially to embed CBO Hints that generate some desirable diagnostics details (and not so much to change plans), such as the ones provided by GATHER_PLAN_STATISTICS and MONITOR. In some cases, after I use the pathfinder tool written by Mauro Pagano, I have to disable a CBO patch (funny thing: I use a SQL Patch to disable a CBO Patch!). I also use a SQL Patch if I need to enable Adaptive Cursor Sharing (ACS) for one SQL (we disabled ACS for one major application). Bear in mind that SQL Plan Baselines, SQL Profiles and SQL Patches happily co-exist, so you can use them together, but I do prefer to use SQL Plan Baselines alone, whenever possible.
SQL Monitoring without MONITOR Hint
I recently got this question:
<<<Is there a way that I can generate SQL MONITORING report for a particular SQL_ID ( This SQL is generated from application code so I can’t add “MONITOR” hint) from command prompt ? If yes can you please help me through this ?>>>
Since this question is of general interest, I’d rather respond here:
As you know, SQL Monitoring starts automatically on a SQL that executes a PX plan, or when its Serial execution has consumed over 5 seconds on CPU or I/O.
If you want to force SQL Monitoring on a SQL statement, without modifying the SQL text itself, I suggest you create a SQL Patch for it. But before you do, please be aware that SQL Monitoring requires the Oracle Tuning Pack.
How to turn on SQL Monitoring for a SQL that executes Serial, takes less than 5 seconds, and without modifying the application that issues such SQL
Use SQL Patch with the MONITOR Hint. An easy way to do that is by using the free sqlpch.sql script provided as part of the cscripts (see right-hand side of this blog under Downloads).
To use sqlpch.sql script, pass as parameter #1 your SQL_ID and for parameter #2 pass “GATHER_PLAN_STATISTICS MONITOR” (without the double quotes).
This sqlpch.sql script will create a SQL Patch for your SQL, which will produce SQL Monitoring (and the collection of A-Rows) for every execution of your SQL.
Be aware there is some overhead involved, so after you are done with your analysis drop the SQL Patch.
Script sqlpch.sql shows the name of the SQL Patch it creates (look at its spool file), and it gives you the command to drop such SQL Patch.
For the actual analysis and diagnostics of your SQL (after you have executed it with SQL Patch in place) use free tool SQLd360.
And for more details about sqlpch.sql and other uses of this script please refer to this entry on my blog.
Skipping ACS ramp-up using a SQL Patch
As I prepare for one of my sessions at ODTUG Kscope14 I came across the typical situation of having a SQL for which I wanted to produce multiple optimal execution Plans on an 11g environment. As you may know, with Adaptive Cursor Sharing (ACS) this is possible and automatic, but the problem is that sometimes the ACS ramp-up process causes some suboptimal Execution Plans. If you want to skip this ACS ramp-up process, lets say for a SQL that is part of a business-critical transaction and which is known to have unstable Plans, then you may want to create a SQL Patch with the BIND_AWARE Hint. Maria Colgan explained this method on this blog post. What I present here is a script I use, so I can easily implement SQL Patches for some SQL where I just need to inject one or two CBO Hints, like this BIND_AWARE. I use SQL Profiles or SQL Plan Management when I need to provide CBO Hints that affect access paths or join order, but if I just need something like skipping ACS ramp-up or a Hint to produce a SQL Monitor report, then I’d rather use SQL Patch.
Script below asks for SQL_ID and for a short list of CBO Hints to include. By default it includes these 3: “GATHER_PLAN_STATISTICS MONITOR BIND_AWARE”. Execute this script connecting as SYS.
----------------------------------------------------------------------------------------
--
-- File name:   sqlpch.sql
--
-- Purpose:     Create Diagnostics SQL Patch for one SQL_ID
--
-- Author:      Carlos Sierra
--
-- Version:     2013/12/28
--
-- Usage:       This script inputs two parameters. Parameter 1 the SQL_ID and Parameter 2
--              the set of Hints for the SQL Patch (default to GATHER_PLAN_STATISTICS
--              MONITOR BIND_AWARE).
--
-- Example:     @sqlpch.sql f995z9antmhxn BIND_AWARE
--
--  Notes:      Developed and tested on 11.2.0.3 and 12.0.1.0
--
---------------------------------------------------------------------------------------
SPO sqlpch.txt;
DEF def_hint_text = 'GATHER_PLAN_STATISTICS MONITOR BIND_AWARE';
SET DEF ON TERM OFF ECHO ON FEED OFF VER OFF HEA ON LIN 2000 PAGES 100 LONG 8000000 LONGC 800000 TRIMS ON TI OFF TIMI OFF SERVEROUT ON SIZE 1000000 NUMF "" SQLP SQL>;
SET SERVEROUT ON SIZE UNL;
COL hint_text NEW_V hint_text FOR A300;
SET TERM ON ECHO OFF;
PRO
PRO Parameter 1:
PRO SQL_ID (required)
PRO
DEF sql_id_1 = '&1';
PRO
PRO Parameter 2:
PRO HINT_TEXT (default: &&def_hint_text.)
PRO
DEF hint_text_2 = '&2';
PRO
PRO Values passed:
PRO ~~~~~~~~~~~~~
PRO SQL_ID   : "&&sql_id_1."
PRO HINT_TEXT: "&&hint_text_2." (default: "&&def_hint_text.")
PRO
SET TERM OFF ECHO ON;
SELECT TRIM(NVL(REPLACE('&&hint_text_2.', '"', ''''''), '&&def_hint_text.')) hint_text FROM dual;
WHENEVER SQLERROR EXIT SQL.SQLCODE;

-- trim sql_id parameter
COL sql_id NEW_V sql_id FOR A30;
SELECT TRIM('&&sql_id_1.') sql_id FROM DUAL;

VAR sql_text CLOB;
VAR sql_text2 CLOB;
EXEC :sql_text := NULL;
EXEC :sql_text2 := NULL;

-- get sql_text from memory
DECLARE
  l_sql_text VARCHAR2(32767);
BEGIN -- 10g see bug 5017909
  FOR i IN (SELECT DISTINCT piece, sql_text
              FROM gv$sqltext_with_newlines
             WHERE sql_id = TRIM('&&sql_id.')
             ORDER BY 1, 2)
  LOOP
    IF :sql_text IS NULL THEN
      DBMS_LOB.CREATETEMPORARY(:sql_text, TRUE);
      DBMS_LOB.OPEN(:sql_text, DBMS_LOB.LOB_READWRITE);
    END IF;
    l_sql_text := REPLACE(i.sql_text, CHR(00), ' '); -- removes NUL characters
    DBMS_LOB.WRITEAPPEND(:sql_text, LENGTH(l_sql_text), l_sql_text);
  END LOOP;
  -- if found in memory then sql_text is not null
  IF :sql_text IS NOT NULL THEN
    DBMS_LOB.CLOSE(:sql_text);
  END IF;
EXCEPTION
  WHEN OTHERS THEN
    DBMS_OUTPUT.PUT_LINE('getting sql_text from memory: '||SQLERRM);
    :sql_text := NULL;
END;
/

SELECT :sql_text FROM DUAL;

-- get sql_text from awr
DECLARE
  l_sql_text VARCHAR2(32767);
  l_clob_size NUMBER;
  l_offset NUMBER;
BEGIN
  IF :sql_text IS NULL OR NVL(DBMS_LOB.GETLENGTH(:sql_text), 0) = 0 THEN
    SELECT sql_text
      INTO :sql_text2
      FROM dba_hist_sqltext
     WHERE sql_id = TRIM('&&sql_id.')
       AND sql_text IS NOT NULL
       AND ROWNUM = 1;
  END IF;
  -- if found in awr then sql_text2 is not null
  IF :sql_text2 IS NOT NULL THEN
    l_clob_size := NVL(DBMS_LOB.GETLENGTH(:sql_text2), 0);
    l_offset := 1;
    DBMS_LOB.CREATETEMPORARY(:sql_text, TRUE);
    DBMS_LOB.OPEN(:sql_text, DBMS_LOB.LOB_READWRITE);
    -- store in clob as 64 character pieces
    WHILE l_offset < l_clob_size
    LOOP
      IF l_clob_size - l_offset > 64 THEN
        l_sql_text := REPLACE(DBMS_LOB.SUBSTR(:sql_text2, 64, l_offset), CHR(00), ' ');
      ELSE -- last piece
        l_sql_text := REPLACE(DBMS_LOB.SUBSTR(:sql_text2, l_clob_size - l_offset + 1, l_offset), CHR(00), ' ');
      END IF;
      DBMS_LOB.WRITEAPPEND(:sql_text, LENGTH(l_sql_text), l_sql_text);
      l_offset := l_offset + 64;
    END LOOP;
    DBMS_LOB.CLOSE(:sql_text);
  END IF;
EXCEPTION
  WHEN OTHERS THEN
    DBMS_OUTPUT.PUT_LINE('getting sql_text from awr: '||SQLERRM);
    :sql_text := NULL;
END;
/

SELECT :sql_text2 FROM DUAL;
SELECT :sql_text FROM DUAL;

-- validate sql_text
BEGIN
  IF :sql_text IS NULL THEN
    RAISE_APPLICATION_ERROR(-20100, 'SQL_TEXT for SQL_ID &&sql_id. was not found in memory (gv$sqltext_with_newlines) or AWR (dba_hist_sqltext).');
  END IF;
END;
/

PRO generate SQL Patch for SQL "&&sql_id." with CBO Hints "&&hint_text."
SELECT loaded_versions, invalidations, address, hash_value
FROM v$sqlarea WHERE sql_id = '&&sql_id.' ORDER BY 1;
SELECT child_number, plan_hash_value, executions, is_shareable
FROM v$sql WHERE sql_id = '&&sql_id.' ORDER BY 1, 2;

-- drop prior SQL Patch
WHENEVER SQLERROR CONTINUE;
PRO ignore errors
EXEC DBMS_SQLDIAG.DROP_SQL_PATCH(name => 'sqlpch_&&sql_id.');
WHENEVER SQLERROR EXIT SQL.SQLCODE;

-- create SQL Patch
PRO you have to connect as SYS
BEGIN
  SYS.DBMS_SQLDIAG_INTERNAL.I_CREATE_PATCH (
    sql_text    => :sql_text,
    hint_text   => '&&hint_text.',
    name        => 'sqlpch_&&sql_id.',
    category    => 'DEFAULT',
    description => '/*+ &&hint_text. */'
  );
END;
/

-- flush cursor from shared_pool
PRO *** before flush ***
SELECT inst_id, loaded_versions, invalidations, address, hash_value
FROM gv$sqlarea WHERE sql_id = '&&sql_id.' ORDER BY 1;
SELECT inst_id, child_number, plan_hash_value, executions, is_shareable
FROM gv$sql WHERE sql_id = '&&sql_id.' ORDER BY 1, 2;
PRO *** flushing &&sql_id. ***
BEGIN
  FOR i IN (SELECT address, hash_value
              FROM gv$sqlarea WHERE sql_id = '&&sql_id.')
  LOOP
    DBMS_OUTPUT.PUT_LINE(i.address||','||i.hash_value);
    BEGIN
      SYS.DBMS_SHARED_POOL.PURGE (
        name => i.address||','||i.hash_value,
        flag => 'C'
      );
    EXCEPTION
      WHEN OTHERS THEN
        DBMS_OUTPUT.PUT_LINE(SQLERRM);
    END;
  END LOOP;
END;
/
PRO *** after flush ***
SELECT inst_id, loaded_versions, invalidations, address, hash_value
FROM gv$sqlarea WHERE sql_id = '&&sql_id.' ORDER BY 1;
SELECT inst_id, child_number, plan_hash_value, executions, is_shareable
FROM gv$sql WHERE sql_id = '&&sql_id.' ORDER BY 1, 2;

WHENEVER SQLERROR CONTINUE;
SET DEF ON TERM ON ECHO OFF FEED 6 VER ON HEA ON LIN 80 PAGES 14 LONG 80 LONGC 80 TRIMS OFF TI OFF TIMI OFF SERVEROUT OFF NUMF "" SQLP SQL>;
SET SERVEROUT OFF;
PRO
PRO SQL Patch "sqlpch_&&sql_id." will be used on next parse.
PRO To drop SQL Patch on this SQL:
PRO EXEC DBMS_SQLDIAG.DROP_SQL_PATCH(name => 'sqlpch_&&sql_id.');
PRO
UNDEFINE 1 2 sql_id_1 sql_id hint_text_2 hint_text
CL COL
PRO
PRO sqlpch completed.
SPO OFF;
About AWR, SQLT and DB360
This blog posting is about answering this first question below, which I often get asked:
Can I use SQLTXPLAIN (SQLT) instead of AWR?
The answer is: it depends. If you are doing SQL Tuning and you already know the SQL_ID, then you may want to use SQLT XTRACT (MOS 215187.1) directly on the SQL_ID of concern. But even in that case, keep in mind that SQLT accesses AWR data, so your environment must have a valid license to use the Oracle Diagnostics Pack. In fact, when you install SQLT, it asks if you have the Oracle Tuning Pack, the Oracle Diagnostics Pack or none. Depending how you respond, SQLT access or not the set of views and APIs included on those Oracle Packs. That means you can configure SQLT to access or not AWR data.
What is the difference between AWR and SQLT?
In short, the difference between these two is the scope. You use AWR to diagnose database performance, while you use SQLT to diagnose one SQL. Sometimes I explain this difference by saying: “AWR is to an entire database to what SQLT is to one SQL”. One is for system-wide performance, the other is very centric to one SQL at a time.
Why SQLT exists?
I envisioned SQLT on the late 90’s when I was a road-warrior fighting fires in the area of performance, and in particular SQL performance. I found back then that Oracle-provided tools like TKPROF were excellent, but I always needed something more, like knowing the state of the CBO Statistics, Tables and Indexes, etc.
These days, my good friend Mauro Pagano from Oracle, is keeping the ball rolling. He is keeping SQLT in constant motion, making it a better tool on every new version. So, I would say this: SQLT is filling up some gaps that me, and many others, consider important in order to be diligent on root cause analysis for cases were a SQL performs poorly.
What is DB360?
As SQLT brings to the table several pieces of information that we need for SQL Tuning, and which are not available using out-of-the-box tools like TKPROF or SQL Monitoring, the new DB360 tool is doing something similar for the entire database: It complements what AWR provides by producing a report with meaningful information about an entire database. This DB360 is a tool that installs nothing on the database, and produces an HTML report with sections such as Configuration, Sizing, CBO Statistics, Performance Trends, etc.
Is DB360 a licensed product?
No. This DB360 tool belongs to Enkitec. It is not yet available to the Oracle community, but it will be soon. Same as SQLT, if you have an Oracle Tuning or Diagnostics Pack, then when you execute DB360 you would get to see in your DB360 report some pieces of information generated out of views and APIs covered by those Oracle Packs, else you get only the pieces which require no Oracle Pack license. Besides the restriction to limit your use of DB360 as per your Oracle Pack license, DB360 itself will be available to the Oracle community for free, and with no strings attached, same as SQLT.
Why are SQLT and DB360 free to download and use?
These tools are simply a contribution to the Oracle community. “Sharing tools is like sharing knowledge: it makes our IT experience more pleasurable”. The only payback comes when you share back with the Oracle community some of your knowledge, or some of your tools and scripts. If you have been a speaker in an Oracle Users Groups, then you may relate to this gratifying experience to share with others what you know. At RMOUG these past 3 days, I have had the opportunity to experience once again this special sense of community, that is always eager to share and to learn from each other.
Conclusion
SQLT complements TKPROF and SQL Monitor. DB360 complements AWR. When it comes to diagnostics, either for one SQL or for an entire Database, having to our disposal additional diagnostics in the context of our analysis, improves our chances to do a diligent job, while reducing the time that it would take to assembly those pieces manually; all with the extra benefit of having these extra diagnostics pieces consistent to a point in time. So, I hope you continue enjoying SQLT and in the near future DB360!
Non-intrusive SQL Trace instrumentation on legacy PL/SQL code
Problem
Legacy PL/SQL code with intermittent performance degradation.
To improve the performance of this code, the first step is to diagnose it. But this code has no instrumentation whatsoever, it is in Production, and rolling any code into Production usually requires rigorous testing. So, whatever method we implement has to be light-weight and as safe as possible.
Using Oradebug is not a viable solution mainly for two reasons: It misses the “head” of the transaction, so we may not get to know the SQL taking longer; and second, internal procedures from finding about the issue, reporting it, then acting on it may take from several minutes to hours.
Solution
- Identify which PL/SQL libraries are known to be problematic in terms of intermittent performance degradation.
- At the beginning of each callable PL/SQL Procedure or Function, add a call to DBMS_APPLICATION_INFO.SET_MODULE to set some appropriate MODULE and ACTION, for example “R252, LOAD”. Call this API also at the end, to NULL out these two parameters. This code change is very small and safe. It introduces practically no overhead. It simply labels every SQL executed by the PL/SQL library with some MODULE and ACTION that uniquely identify the code of concern.
- Activate SQL Trace on the module/action that needs to be traced, by calling DBMS_MONITOR.SERV_MOD_ACT_TRACE_ENABLE, passing parameters SERVICE, MODULE and ACTION. With this API request a SQL Trace to be generated with WAITs and BINDs (binds are optional but desirable). Once these traces are no longer needed (reviewed by someone), turn SQL Trace off using API DBMS_MONITOR.SERV_MOD_ACT_TRACE_DISABLE.
- Once the SQL Trace is produced, generate a TKPROF on it. You may want to include parameter “sort=exeela fchela”. This way you get the slower SQL at the top of the TKPROF report.
- With SQL Trace and TKPROF, identify the slower SQL and use SQL Monitor and/or SQL XTRACT to get more granular diagnostics (you need to identify SQL_ID). On any given PL/SQL library, it is common that 1~5 SQL statements consume > 80% of the Elapsed Time. Focus on these large consumers.
Conclusion
Producing a SQL Trace with EVENT 10046 level 8 or 12 is very useful to properly diagnose the code on a PL/SQL library which performs poorly. A follow-up on the slower SQL with SQL Monitor and/or SQLT XTRACT is in order. The method presented above is very easy and safe to implement.
SQL Monitor and SQL ASH Scripts are now available
I just uploaded two new scripts to my set of “Shared Scripts“. These are the sqlmon.sql and the sqlash.sql. They both input a SQL_ID and produce some txt/html/zip output.
The sqlmon.sql produces SQL Monitor Reports for all executions available on SQL Monitor for a given SQL. It is RAC aware and its output includes both text and “active” reports. You must have an Oracle Tuning Pack license on the system where you may want to use it.
The sqlash.sql produces Active Session History (ASH) Reports for one SQL_ID. It is also RAC aware and output includes both text and html formats. It produces these ASH reports from both memory and AWR. You must have an Oracle Diagnostics Pack license on the system where you may want to use it.
These two scripts are light weight. Install nothing, change nothing. If you need a more robust diagnostic tool in these areas, please use SQLHC and/or SQLT. In the other hand, for a quick understanding of one SQL you may want to use the trio: planx.sql, sqlash.sql and sqlmon.sql.
SQL Tuning with SQLTXPLAIN 2-days Workshop
SQLTXPLAIN is a SQL Tuning tool widely used by the Oracle community. Available through My Oracle Support (MOS) under document 215187.1, this free tool is available for download and use to anyone with MOS access. It has helped thousands of times to expedite the resolution of SQL Tuning issues, and many Oracle DBAs and Developers benefit of its use on a daily basis.
Stelios Charalambides has done an excellent job writing a book on this topic. In his book Stelios covers many aspects about SQLTXPLAIN and some related topics. I highly recommend to get a copy of this book if you want to learn more about SQLTXPLAIN. It is available at Amazon and many other retailers.
The new 2-days SQLTXPLAIN Workshop offered by Enkitec (an Oracle Platinum business partner and my employer) is a completely new course that interleaves “how to use effectively SQLTXPLAIN” with important and related SQL Tuning Topics such as Plan Flexibility and Plan Stability. This hands-on workshop offers participants the unique opportunity to fully understand the contents of SQLTXPLAIN and its vast output through an interactive session. About half the time is dedicated to short guided labs, while the other half uses presentations and demos. This workshop is packed with lots of content. It was a real challenge packaging so much info in only two days, but I am very pleased with the result. It became a 2-days intensive knowledge transfer hands-on workshop on SQLTXPLAIN and SQL Tuning!
The first session of this workshop is scheduled for November 7-8 in Dallas, Texas. I expect this pilot session to fill out fast. Other sessions and onsite ones will be offered during 2014. I hope to meet many of you face to face on November 7!
Monitoring a SQL that executes well thousands of times but sometimes it takes longer
Problem Description
There is this SQL that is constantly executed by many users. This SQL executes in a subsecond thousands of times per day. Every once in a while the same SQL takes several seconds but these incidents are uncommon. Tracing would cause significant overhead since there is no known way to predict when an execution may take longer. In this scenario the concern is finding the root cause of these elusive spikes in the performance of this SQL.
Strategy
Use SQL Monitor report to watch for any SQL that takes longer than a few seconds. Then produce a comprehensive report that would bring some initial light to these spikes. The challenge is to capture this information 24×7 without imposing a significan overhead.
Solution
Implement a script that loops over SQL Monitor views and capture any SQL that took or is taking more than a few seconds. Then review these reports searching by sql_text.
Steps
1. Open a new session and execute mon_repository.sql followed by mon_capture.sql. The latter will loop indefinitely.
2. On a second session execute mon_reports.sql every so often.
3. Review table v_sql_monitor by sql_text then read corresponding report on zip.
Scripts
mon_repository.sql
REM $Header: mon_repository.sql 11.4.5.7.1 2013/04/24 carlos.sierra $

DROP TABLE v_sql_monitor;

CREATE TABLE v_sql_monitor (
 sql_id VARCHAR2(13),
 key NUMBER,
 sql_exec_start DATE,
 sql_exec_id NUMBER,
 status VARCHAR2(19),
 first_refresh_time DATE,
 last_refresh_time DATE,
 username VARCHAR2(30),
 capture_date DATE,
 report_date DATE,
 sql_text VARCHAR2(2000),
 mon_report CLOB,
PRIMARY KEY (sql_id, key));
mon_capture.sql
REM $Header: mon_capture.sql 11.4.5.7.1 2013/04/24 carlos.sierra $
DECLARE
 l_mon_report CLOB;
BEGIN
 LOOP
 INSERT INTO v_sql_monitor (sql_id, key, sql_exec_start, sql_exec_id, status, first_refresh_time, last_refresh_time, sql_text, username )
 SELECT v.sql_id, v.key, v.sql_exec_start, v.sql_exec_id, v.status, v.first_refresh_time, v.last_refresh_time, v.sql_text, v.username
 FROM v$sql_monitor v
 WHERE v.process_name = 'ora'
 AND v.sql_text IS NOT NULL
 AND UPPER(v.sql_text) NOT LIKE 'BEGIN%'
 AND UPPER(v.sql_text) NOT LIKE 'DECLARE%'
 AND (v.status LIKE 'DONE%' OR (v.status = 'EXECUTING' AND (v.last_refresh_time - v.first_refresh_time) > 1/24/60 /* 1 min */))
 AND NOT EXISTS (SELECT NULL FROM v_sql_monitor t WHERE t.sql_id = v.sql_id AND t.key = v.key);

FOR i IN (SELECT t.*, t.ROWID row_id FROM v_sql_monitor t WHERE t.capture_date IS NULL)
 LOOP
 l_mon_report := DBMS_SQLTUNE.REPORT_SQL_MONITOR (
 sql_id => i.sql_id,
 sql_exec_start => i.sql_exec_start,
 sql_exec_id => i.sql_exec_id,
 report_level => 'ALL',
 type => 'ACTIVE' );

UPDATE v_sql_monitor
 SET mon_report = l_mon_report,
 capture_date = SYSDATE
 WHERE ROWID = i.row_id;
 END LOOP;

COMMIT;

DBMS_LOCK.SLEEP(60); -- sleep 1 min
 END LOOP;
END;
/
mon_reports.sql
REM $Header: mon_reports.sql 11.4.5.7.1 2013/04/24 carlos.sierra $
SET ECHO OFF FEED OFF VER OFF SHOW OFF HEA OFF LIN 2000 NUM 20 NEWP NONE PAGES 0 LONG 2000000 LONGC 2000 SQLC MIX TAB ON TRIMS ON TI OFF TIMI OFF ARRAY 100 NUMF "" SQLP SQL> SUF sql BLO . RECSEP OFF APPI OFF AUTOT OFF SERVEROUT ON SIZE UNL;

SPO reports_driver.sql;
PRO SET ECHO OFF FEED OFF VER OFF SHOW OFF HEA OFF LIN 2000 NUM 20 NEWP NONE PAGES 0 LONG 2000000 LONGC 2000 SQLC MIX TAB ON TRIMS ON TI OFF TIMI OFF ARRAY 100 NUMF "" SQLP SQL> SUF sql BLO . RECSEP OFF APPI OFF AUTOT OFF SERVEROUT ON SIZE UNL;;
BEGIN
 FOR i IN (SELECT t.sql_id, t.key, t.ROWID row_id FROM v_sql_monitor t WHERE t.report_date IS NULL)
 LOOP
 DBMS_OUTPUT.PUT_LINE('SPO sql_id_'||i.sql_id||'_key_'||i.key||'.html;');
 DBMS_OUTPUT.PUT_LINE('SELECT mon_report FROM v_sql_monitor WHERE sql_id = '''||i.sql_id||''' AND key = '||i.key||';');
 DBMS_OUTPUT.PUT_LINE('SPO OFF;');
 DBMS_OUTPUT.PUT_LINE('UPDATE v_sql_monitor SET report_date = SYSDATE WHERE ROWID = '''||i.row_id||''';');
 DBMS_OUTPUT.PUT_LINE('HOS zip -m mon_reports sql_id_'||i.sql_id||'_key_'||i.key||'.html');
 END LOOP;
END;
/
PRO COMMIT;;
PRO SET TERM ON ECHO OFF FEED 6 VER ON SHOW OFF HEA ON LIN 80 NUM 10 NEWP 1 PAGES 14 LONG 80 LONGC 80 SQLC MIX TAB ON TRIMS OFF TI OFF TIMI OFF ARRAY 15 NUMF "" SQLP SQL> SUF sql BLO . RECSEP WR APPI OFF SERVEROUT OFF AUTOT OFF;;
SPO OFF;

@reports_driver.sql

HOS zip -m mon_reports reports_driver.sql
HOS unzip -l mon_reports

SET TERM ON ECHO OFF FEED 6 VER ON SHOW OFF HEA ON LIN 80 NUM 10 NEWP 1 PAGES 14 LONG 80 LONGC 80 SQLC MIX TAB ON TRIMS OFF TI OFF TIMI OFF ARRAY 15 NUMF "" SQLP SQL> SUF sql BLO . RECSEP WR APPI OFF SERVEROUT OFF AUTOT OFF;
2-days open SQL Tuning Class in Pleasanton, CA this month!
I will be delivering a two-days SQL Tuning class on February 19-20 in Pleasanton, CA. It is available to registered Oracle Users thanks to the help from NoCOUG. Space is limited, so if you want to attend you need to hurry up.
This class covers:
- CBO statistics (fundamentals and good practices);
- Tracing with Events 10046 and 10053;
- Plan Stability with Adaptive Cursor Sharing (ACS) and SQL Plan Management (SPM);
- SQL Tuning tools: Trace Analyzer TRCANLZR (TRCA), SQLTXPLAIN (SQLT) and SQL Health-Check (SQLHC); and
- SQL Tuning Test Cases (creation and implementation).
This is the first time this 2-days class is offered outside Oracle. Its content is an extract of the internal SQL Tuning Workshops I have developed and delivered to over 700 Oracle Engineers around the globe.
This is not an Oracle University (OU) class, which means the scope is more into the actual trades of the day-to-day life of SQL Tuning and less into product features. So if you have taken a SQL Tuning OU class, then this 2-days session would be a nice addition.
Another thing that you should expect from this class is lots of participation. In my sessions I always encourage participants to bring to the table their current SQL Tuning issues or concerns, so we can openly analyze and discuss them during class. The environment is friendly, welcoming and open.
I hope you can join us on February 19-20.
Deep-dive on SQLTXPLAIN offered externally for the first time
The Rocky Mountain Oracle Users Group (RMOUG) Training Days is approaching soon: February 11-13, 2013. I hope you are attending this Oracle relevant event. There are so many good sessions that it is hard to decide which ones to attend!
For the first time, I will be conducting a 4-hours deep-dive external-session on SQLTXPLAIN (SQLT). The title is Using SQLTXPLAIN (SQLT) to Diagnose SQL Statements Performing Poorly. If you want to know SQLT from the basics to an intermediate level, consider attending this 4-hrs session. It will be offered on Monday, February 11 from 1 to 5 pm at the Colorado Convention Center in Denver, Colorado (USA). I love interactive sessions, so I will encourage voluntary participation and open discussions.
In addition to the 4-hrs deep-dive on SQLT, I will also speak on Wednesday, February 13 at 8:30 am about How to Improve SQL Performance with New SQL Health Check Tool. This is a 1-hour seminar with plenty of time for Q&A.
If you attend the event and want to discuss any issue with regard to SQLTXPLAIN (SQLT), SQL Health-Check (SQLHC) or simply SQL Tuning, please approach me. I will be there to help, share, listen, learn, discuss, etc.
