Archive for the ‘General’ Category
ASH Analytics from SQL*Plus
I used to like (Average Active Session History) ASH Analytics available trough Oracle Enterprise Manager (OEM). Then OEM was not always available, or the time to reach it was too long, or its access too cumbersome at best. Slowly for surely, I started using (and developing) stand-alone scripts to get what I needed from ASH in a timely manner.
Many Developers and even DBAs have access to an Oracle database through SQL*Plus, but not to OEM or any other GUI to check on database performance. And in many cases, access is only available through a client machine (i.e. your Mac or PC), but never to the actual database server directly.
If your site has an Oracle Diagnostics Pack License (i.e. you are authorized to access AWR and ASH data), then you can query your ASH data through SQL*Plus and generate some text-based reports. But, if you’d rather do your analysis visualizing your performance data through time-based charts, you could use tools such as SQLdb360, or some stand-alone scripts that execute on SQL*Plus (client or server-side) and produce charts like the one below. Note that such tools and scripts query AWR and ASH data.
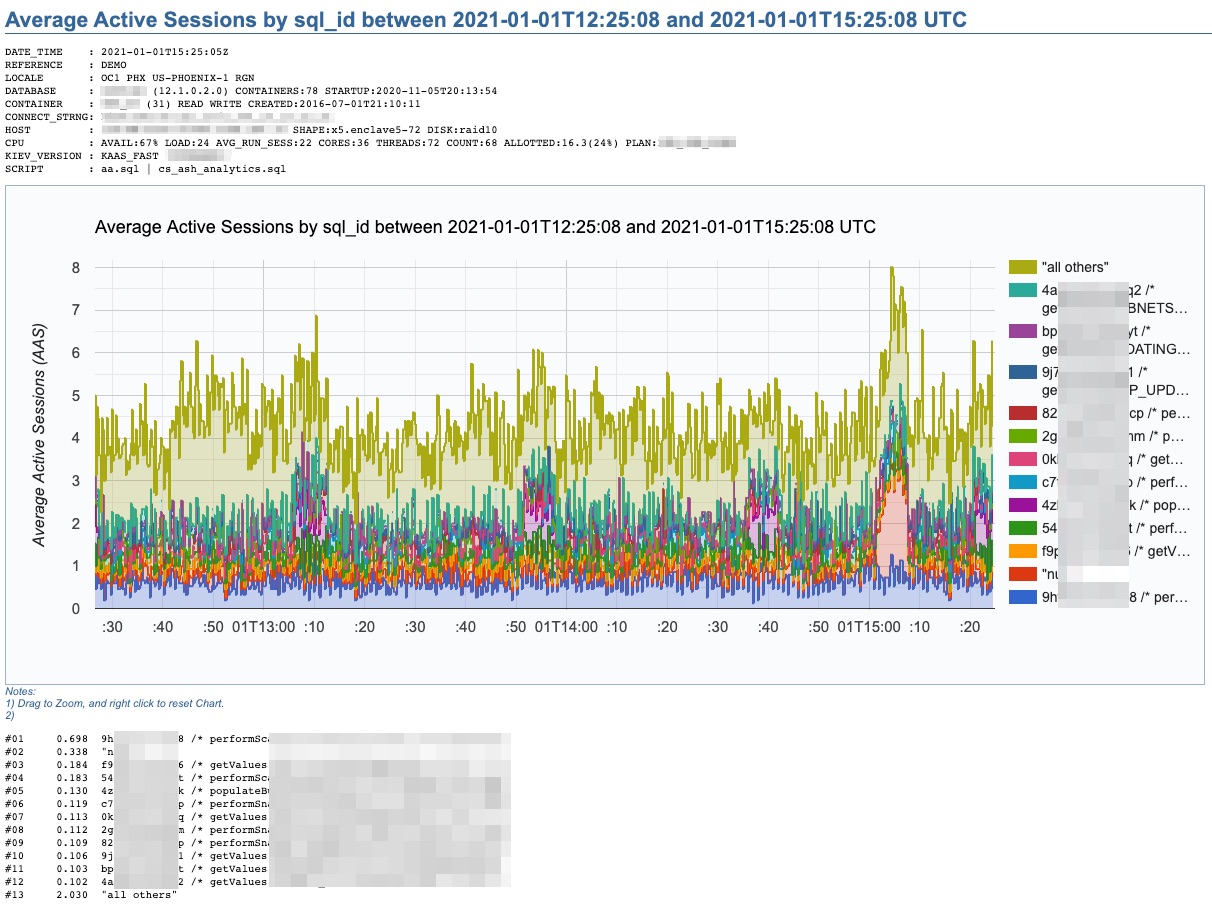
This chart above was produced by what I call “a poor’s man ASH analytics”. It gives me what I need in order to make an initial performance assessment in just a few minutes. It also allows me to properly document cases. This script cs_ash_analytics.sql is part of a subset of the “CS scripts“, available to download and use “as is” for free. Just be aware that many of these scripts should only be used if your site has a License for the Oracle Diagnostics or Tuning Packs. I use the “CS scripts” on a daily basis. And I update them every so often.
This one “ASH analytics” script, when executed from SQL*Plus, allows you to generate a time-based chart on recent (V$) or more persistent (DBA_HIST) ASH data. It provides for diverse dimension options such as: Wait Class, Event, Machine, SQL_ID, Plan Hash Value, Top Level SQL_ID, Blocking Session, Current Obj#, Module or PDB Name. Scope can be filtered by Session State, Wait Class, Event, Machine, SQL Text or SQL_ID. Time window can span a few minutes, hours or days. Time granularity can be specified or let it default as per time window size.
The beauty of this cs_ash_analytics.sql script is that it runs in seconds, produces a nice Google chart, it executes from SQL*Plus, and the script itself is free to download and use (always validate first your site has a proper Oracle Pack License).
Introducing SQLdb360: merging eDB360 and SQLd360, while rising the bar to community engagement
Today, we are very happy to release SQLdb360, a new tool that merges together eDB360 and SQLd360, under a single package.
Tools eDB360 and SQLd360 can still be used independently, but now there is only one package to download and keep updated. All the new features and updates to both tools are now in that one package.
The biggest change that comes with SQLdb360 is the kind invitation to everyone interested to contribute to its development. This is why the new blended name and its release format.
We do encourage your help and ideas to continue building a free, open-source, and hopefully a YMMV great tool!
Over the years, a few community members requested new features, but they were ultimately slowed down by our speed of reaction to their requests. Well, no more!
Few consumers of these tools implemented cool changes they needed, sometimes sending us the changes (or pull requests) until a later time. This means good ideas were available to others after some time. Not anymore!
If there is something you’d like to have as part of SQLdb360 (aka SQLd360 and eDB360), just write and test the additional code, then send us the pull request! Next, we will review, validate, and merge your code changes to the main tool.
There are several advantages to this new approach:
- Carlos and Mauro won’t dictate the direction of the tool anymore: we will continue helping and contributing, but we won’t “own” it anymore (the community will!)
- Carlos and Mauro won’t slow down the development anymore: nobody is the bottleneck now!
- Carlos and Mauro wan’t run out of ideas anymore!!! The community has great ideas to share!!!
Due to the nature of this new collaborative effort, the way we now publish SQLdb360 is this:
- Instead of linking to the current master repository, the tool now implements “releases”. This, in order to snapshot stable versions that bundle several changes together (better than creating separate versions per merge into master).
- Links in our blogs are now getting updated, with references to the latest (and current) stable release of SQLdb360 (starting with v18.1).
Note: Version names sound awfully familiar to Oracle nomenclature, right? Well, we started using this numbering back in 2014!!!
Carlos & Mauro
eDB360 takes long to execute!
eDB360 provides a lot of insight about an Oracle database. It executes thousands of SQL statements querying GV$ and DBA views from the Oracle’s data dictionary. It was designed to impose very little load on the system where it executes, thus it consumes only one session and avoids parallel execution. On a system where the state of historical metrics is “normal”, eDB360 may take one or two hours to execute. In the other hand, when the volume of historical metrics is abnormally “large”, then eDB360 may execute for many hours up to default threshold of 24, then quit. No worries here, it can be restarted pretty much where it left…
If you are considering executing eDB360 on one of your databases, before you do please execute first a light-weight “pre-check”, which is basically a small script that reports on the state of Active Session History (ASH) stored into the Automatic Workload Repository (AWR). Bare in mind that ASH and AWR are part of the Oracle Diagnostics Pack, so consider such “pre-check” only if you have a license for such Oracle Pack for the target database.
AWR ASH Pre-Check
You can execute stand-alone the awr_ash_pre_check.sql script available as free software in GitHub within edb360-master or cscripts-master. If downloading eDB360, you can find awr_ash_pre_check.sql under the edb360-master/sql directory, and if you download the cscripts set, then you can find awr_ash_pre_check.sql under cscripts-master/sql.
This pre-check script reports on the following potential concerns:
- Retention period of AHR, frequency of Snapshots, AWR Baselines, and similar.
- Age of CBO Statistics on the main table behind DBA_HIST_ACTIVE_SESS_HISTORY (WRH$_ACTIVE_SESSION_HISTORY) and its partitions.
- State of CBO Statistics for WRH$_ACTIVE_SESSION_HISTORY segments: Are the statistics Locked? Are they Stale?
- Size of WRH$_ACTIVE_SESSION_HISTORY segments, with range of Snapshots per segment (partition). Are they outside the desired retention window?
- Creation date and last DDL date for WRH$_ACTIVE_SESSION_HISTORY segments. So expected partition splitting can be verified.
Take for example result below. It shows that current ASH repository contains 320.6 days of history, even when in this case only 30 were requested (displayed on an upper part of report not shown here). We also see ASH is 16.4 GBs in size, where normally 1-2 GBs are plenty. We can conclude last partition split (or simply last DDL) is 289.7 days old, where normally only a few days-old are expected. This pre-check sample results on a ballpark estimate of 127 hours to execute eDB360. In other words, if we had one month of history (as current AWR configuration requests) instead of 320.6 days of history, then ASH repository would be less than 10% its current size and eDB360 would be estimated to execute in about 13 hours instead of 127. Keep in mind this “pre-check” provides a ballpark estimate, so an actual execution of eDB360 would take more or less the estimated time.
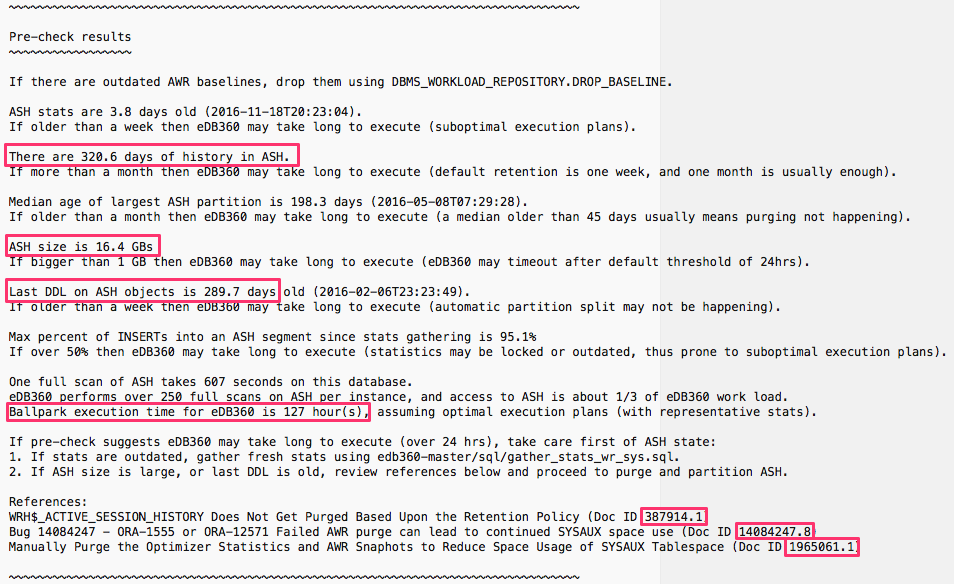
What to do if eDB36o is estimated to run for several days like in sample above? What I recommend is to fix ASH first. This process requires to read and digest at least 3 My Oracle Support (MOS) notes below, but it is not as bad as it sounds. You want to follow this path anyways, so any diagnostics tool that relies on ASH from AWR would benefit of the much needed cleanup.
- WRH$_ACTIVE_SESSION_HISTORY Does Not Get Purged Based Upon the Retention Policy (Doc ID 387914.1)
- Bug 14084247 – ORA-1555 or ORA-12571 Failed AWR purge can lead to continued SYSAUX space use (Doc ID 14084247.8)
- Manually Purge the Optimizer Statistics and AWR Snaphots to Reduce Space Usage of SYSAUX Tablespace (Doc ID 1965061.1)
Diagnosing eDB360 taking long
Let’s say you executed an older version of eDB360 and it took long (newer versions starting on v1620 perform an automatic pre-check, and if execution is estimated to last more than 8 hours, then it pauses and ask for confirmation before executing). If you executed an older version of eDB360, or simply your execution took longer than expected, review next the following files included on the directory from where you executed eDB360 (edb360-master), or stored within the edb360_*.zip file generated by eDB360 as it executed.
- awr_ash_pre_check_<database_name>.txt
- verify_stats_wr_sys_<database_name>.txt
- 00002_edb360_<NNNNNN>_log.txt
- 00003_edb360_<NNNNNN>_log2.txt
- 00004_edb360_<NNNNNN>_log3.txt
- 00005_edb360_157536_tkprof_sort.txt
If you find one of the SQL statements from eDB360 is taking more than a few minutes to execute, suspect first outdated CBO statistics on the Data Dictionary objects behind such query. Or if volume of data accessed by such query from eDB360 is large, suspect AWR data not getting purged. In either case take action accordingly.
If you cannot make sense of the information provided by these diagnostics files above, then contact eDB360 author at carlos.sierra.usa@gmail.com.
Keep in mind that execution time for eDB360 really depends on the state of several metrics stored in AWR, where ASH is the most relevant piece but not the only one. Think outdated statistics and outdated metrics!
Using eDB360 – introduction video
This is a short video that explains what is eDB360, where to download it from, how to execute it, and what the output is. Enjoy!
Using edb360 – introduction video from Carlos Sierra on Vimeo.
Learn how free new tool sqld360 can tell you so much about your favorite SQL!
New tool sqld360 is now available! Mauro Pagano released this cool new tool a few hours ago. And yes, it is free for all!
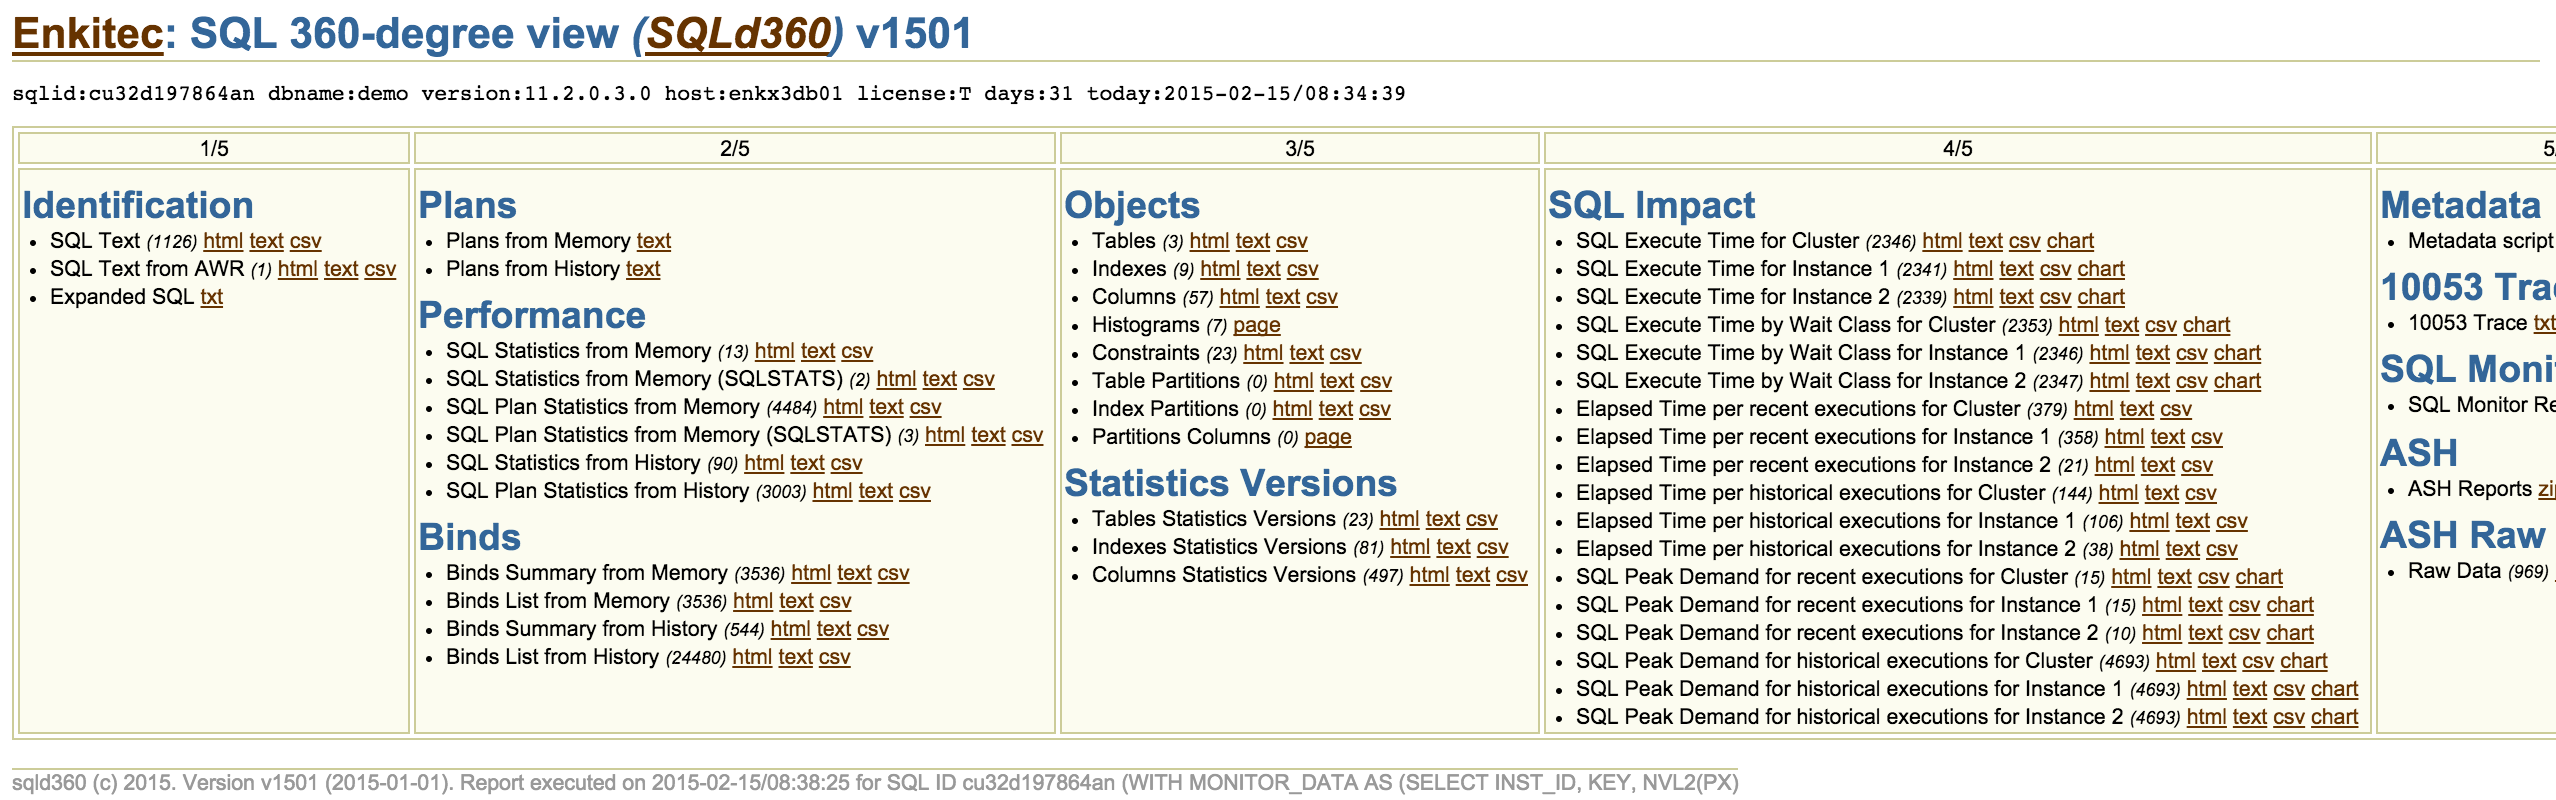
So, what is sqld360? Well, it is an install-nothing free software that tells you a lot about one SQL statement. And if your site has an Oracle Tuning Pack or Diagnostics Pack license, then you get a lot more from sqld360. Sample snapshot below shows you the dynamic menu for a simple SQL. This sqld360 new tool uses similar techniques than edb360, so it displays information as html, text, csv and in some cases it uses some cool Google charts.
The obvious question is why would I use this sqld360 instead of SQLT or SQLHC? The answer is: you can use them all. What makes sqld360 different to SQLT is that sqld360 installs nothing on the database. And what makes sqld360 different to SQLHC is that sqld360 is available as free software on a GitHub repository, so you don’t have to have a MOS account available. Any Oracle user can download and use sqld360 starting today!
In terms of content, I can say that SQLHC gives you some Observations and sqld360 does not (yet). Besides that, I think sqld360 is superior to SQLHC simply because it is more mature and developed from scratch using newer techniques.
SQLT is a different animal. It provides tons of functionality developed over a decade. This sqld360 is on its first release, but it will certainly grow over time but only in the right directions. From the beginning, sqld360 focuses on what is important for tuners and for those in need to diagnose a SQL misbehaving. So simply put, sqld360 is faster and better focused than SQLT and SQLHC. We can call it “the next generation”.
Why free? The answer is: Why not? When Mauro and I started discussing sqld360, we decided to continue developing cool scripts and tools on our own personal time, on our own hardware, and without taking anything from anyone. So this is kind of our contribution to our Oracle community. I have provided edb360 and Mauro is providing sqld360. Mauro and myself would love to blog more often, but if we have to decide where to put our personal time, we both are more inclined to invest on free tools (after of course our family duties).
It is hard to appreciate with a sample execution from one of our systems, but if you look at chart below you may get to see how a SQL of interest compares to the system load. This kind of chart is helpful when you are trying to understand how a particular SQL affects a given load for a certain time window. Or when you need to documents your findings to business leaders.
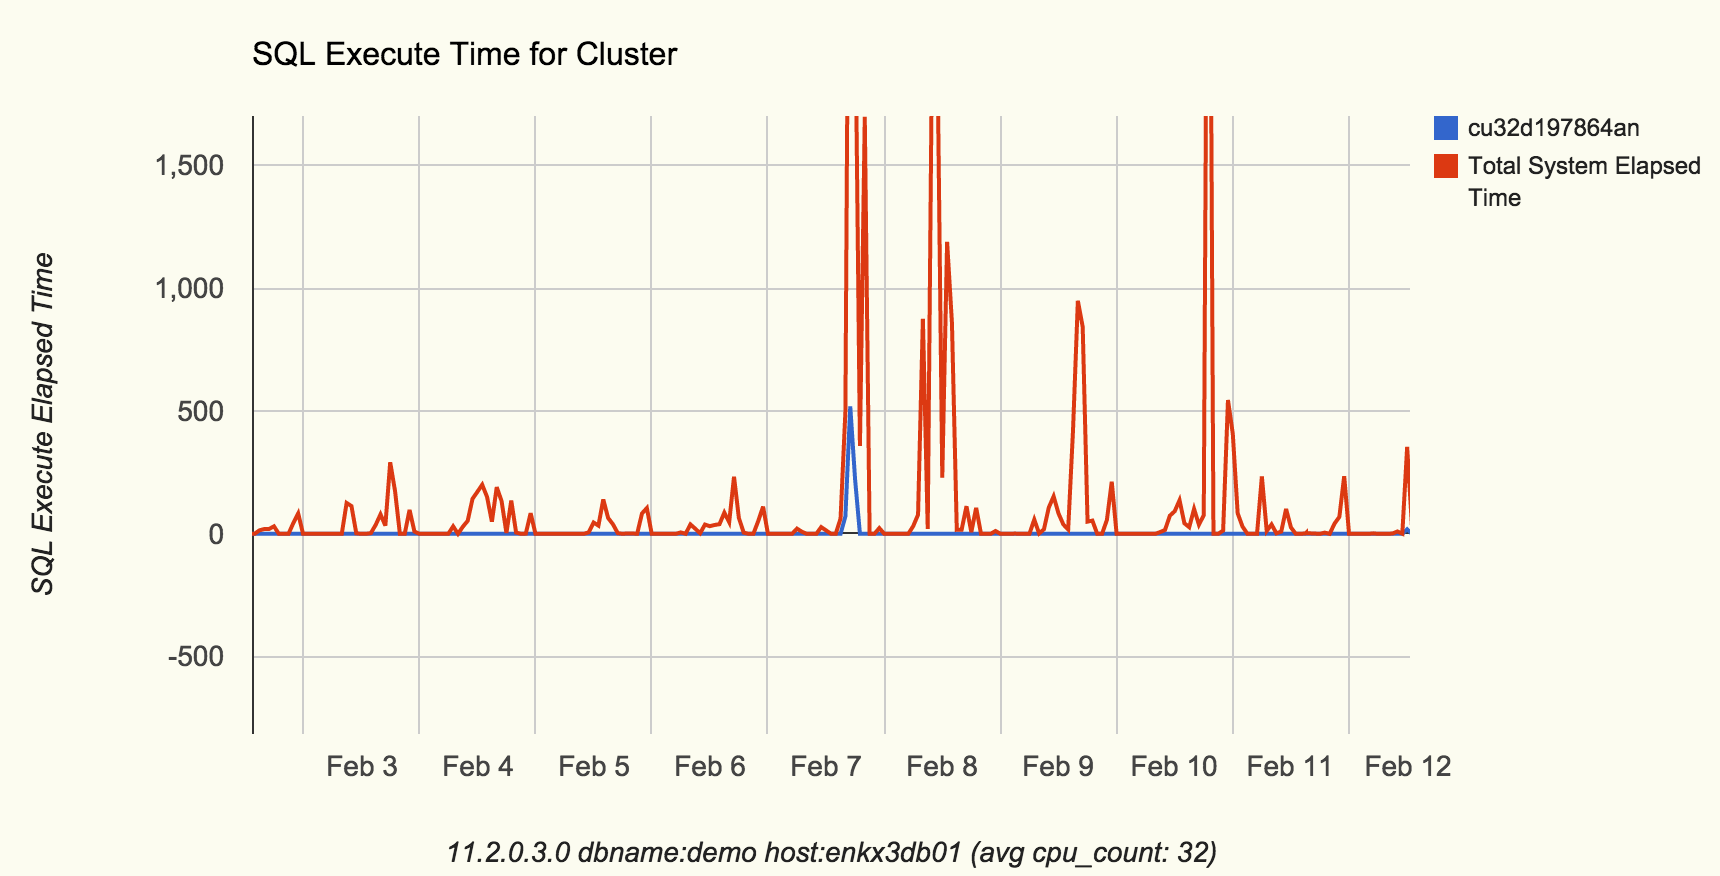
I could continue telling more about sqld360, but the best way to appreciate it is by actually trying it on one of your own SQL statements. You can go to Mauro’s blog post about sqld360 and download this tool following instructions there. Then give it a shot, after all you have nothing to loose.
Forgot to mention this: sqld360 as well as edb360 work through a SQL*Plus connection, either on the database server or on a PC client. This is important since quite often we road-warriors and even in-house developers may not have access to OEM or some other persistently-connected tools. Then, with sqld360 and edb360, using a SQL*Plus connection you can extract enough metadata to analyze and comprehend what is happening on the entire database or around one particular SQL, all without having to be persistently-connected to the database. Yes, you can do all your analysis remotely from home! yay!
And, by the way, as of today edb360 calls sqld360 on SQL of interest. So if you are already using edb360 you may want to download version v1504 dated February 15, 2015. This edb360 v1504 contains sqld360.
I hope you enjoy both tools. Life is Good!
Why do you need to gather CBO Statistics?
As I help a peer with a SQL Tuning engagement, I face the frequent case of: “We do not want to gather CBO schema object statistics because we don’t want our Execution Plans to change”. Well, the bad news is that: not gathering stats only gives you a false sense of safety because your Execution Plans can change anyways. The reason has to do with Predicates referencing values out of range. Typical cases include range of dates, or columns seeded with values out of a sequence (surrogate keys). Most applications use them both. Example: predicate that references last X days of data. Imagine that date column on this predicate actually has statistics with low and high value that are outdated, lets say the high value refers to last time we gather stats (several months old). In such cases, the CBO uses some heuristics starting on 10g, where the cardinality of the Predicate is computed according to range of low/high and how far the value on Predicate is from this low/high range as per the stats. In short, the cardinality changes over time, as the Predicate on the last X days of data changes from one day to the next, and the next, and so on. At some point, the CBO may decide for a different Plan (with lower cost) and the performance of such SQL may indeed change abruptly. Then we scratch our heads and repeat to ourselves: but we did not gather statistics, why did the plan change?
So, if you understand the rationale above, then you would agree with the fact that: not updating CBO schema stats do not offer any real Plan Stability. So, my recommendation is simple: have reasonable CBO statistics and live with the possibility that some Plans will change (they would change anyways, even if you do not gather stats). Keep always in mind this:
The CBO has better chances to produce optimal Plans if we provide reasonable CBO statistics.
Now the good news: if you have some business critical SQL statements and you want them to have stable Plans, then Oracle already provides SQL Plan Management, which is designed exactly for Plan Stability. So, instead of gambling everyday, hoping for your Plans not to change preserving outdated stats, rather face reality, then gather stats, and create SQL Plan Baselines in those few SQL statements that may prove to have an otherwise unstable Plan and are indeed critical for your business. On 10g you can use SQL Profiles instead.
On 10g and 11g, just let the automatic job that gathers CBO schema statistics do its part. In most cases, that is good enough. If you have transient data, for example ETL tasks, then you may want to have the process workflow to gather stats on particular Tables as soon as the data is loaded or transformed and before it is consumed. The trick is simple: “have the stats represent the data at all times”. At the same time, there is no need to over do the stats, just care when the change on the data is sensible.
