How to upgrade Dynamic Sampling on a Query already using an imported SQL Profile
Problem
I have this query that references a couple of Global Temporary Tables (GTT). These GTT have no CBO Statistics, thus Dynamic Sampling (DS) is used on them. The problem is default value of 2 at the instance level samples only 64 blocks and these GTT are large. Testing with DS on larger samples provides better quality on these dynamic statistics and a better performing Execution Plan for this particular SQL.
This SQL already uses an imported SQL Profile generated by coe_xfr_sql_profile.sql out of SQLT (MOS 215187.1) under sqlt/utl directory. This SQL Profile contains CBO Hints created out of the Outline Data contained on the other_xml column of the Plan. Still a higher level of DS is needed for these two GTT in order to produce a better performing Plan. Setting DS at the instance level or session level is not an option. Modifying the query is not an option. So the question is: “how to embed a dynamic sampling hint on a SQL that already has a SQL Profile based on an Outline“?
Solution
On the script generated by coe_xfr_sql_profile.sql add one extra Hint with the DS level that is needed. Look at sample below, where one extra Hint has added right below DB_VERSION. Since the two GTT have no CBO Statistics, they invoke DS, which would use now level 6 instead of 2.
h := SYS.SQLPROF_ATTR(
q'[BEGIN_OUTLINE_DATA]',
q'[IGNORE_OPTIM_EMBEDDED_HINTS]',
q'[OPTIMIZER_FEATURES_ENABLE('11.2.0.3')]',
q'[DB_VERSION('11.2.0.3')]',
q'[OPT_PARAM('optimizer_dynamic_sampling' 6)]',
q'[ALL_ROWS]',
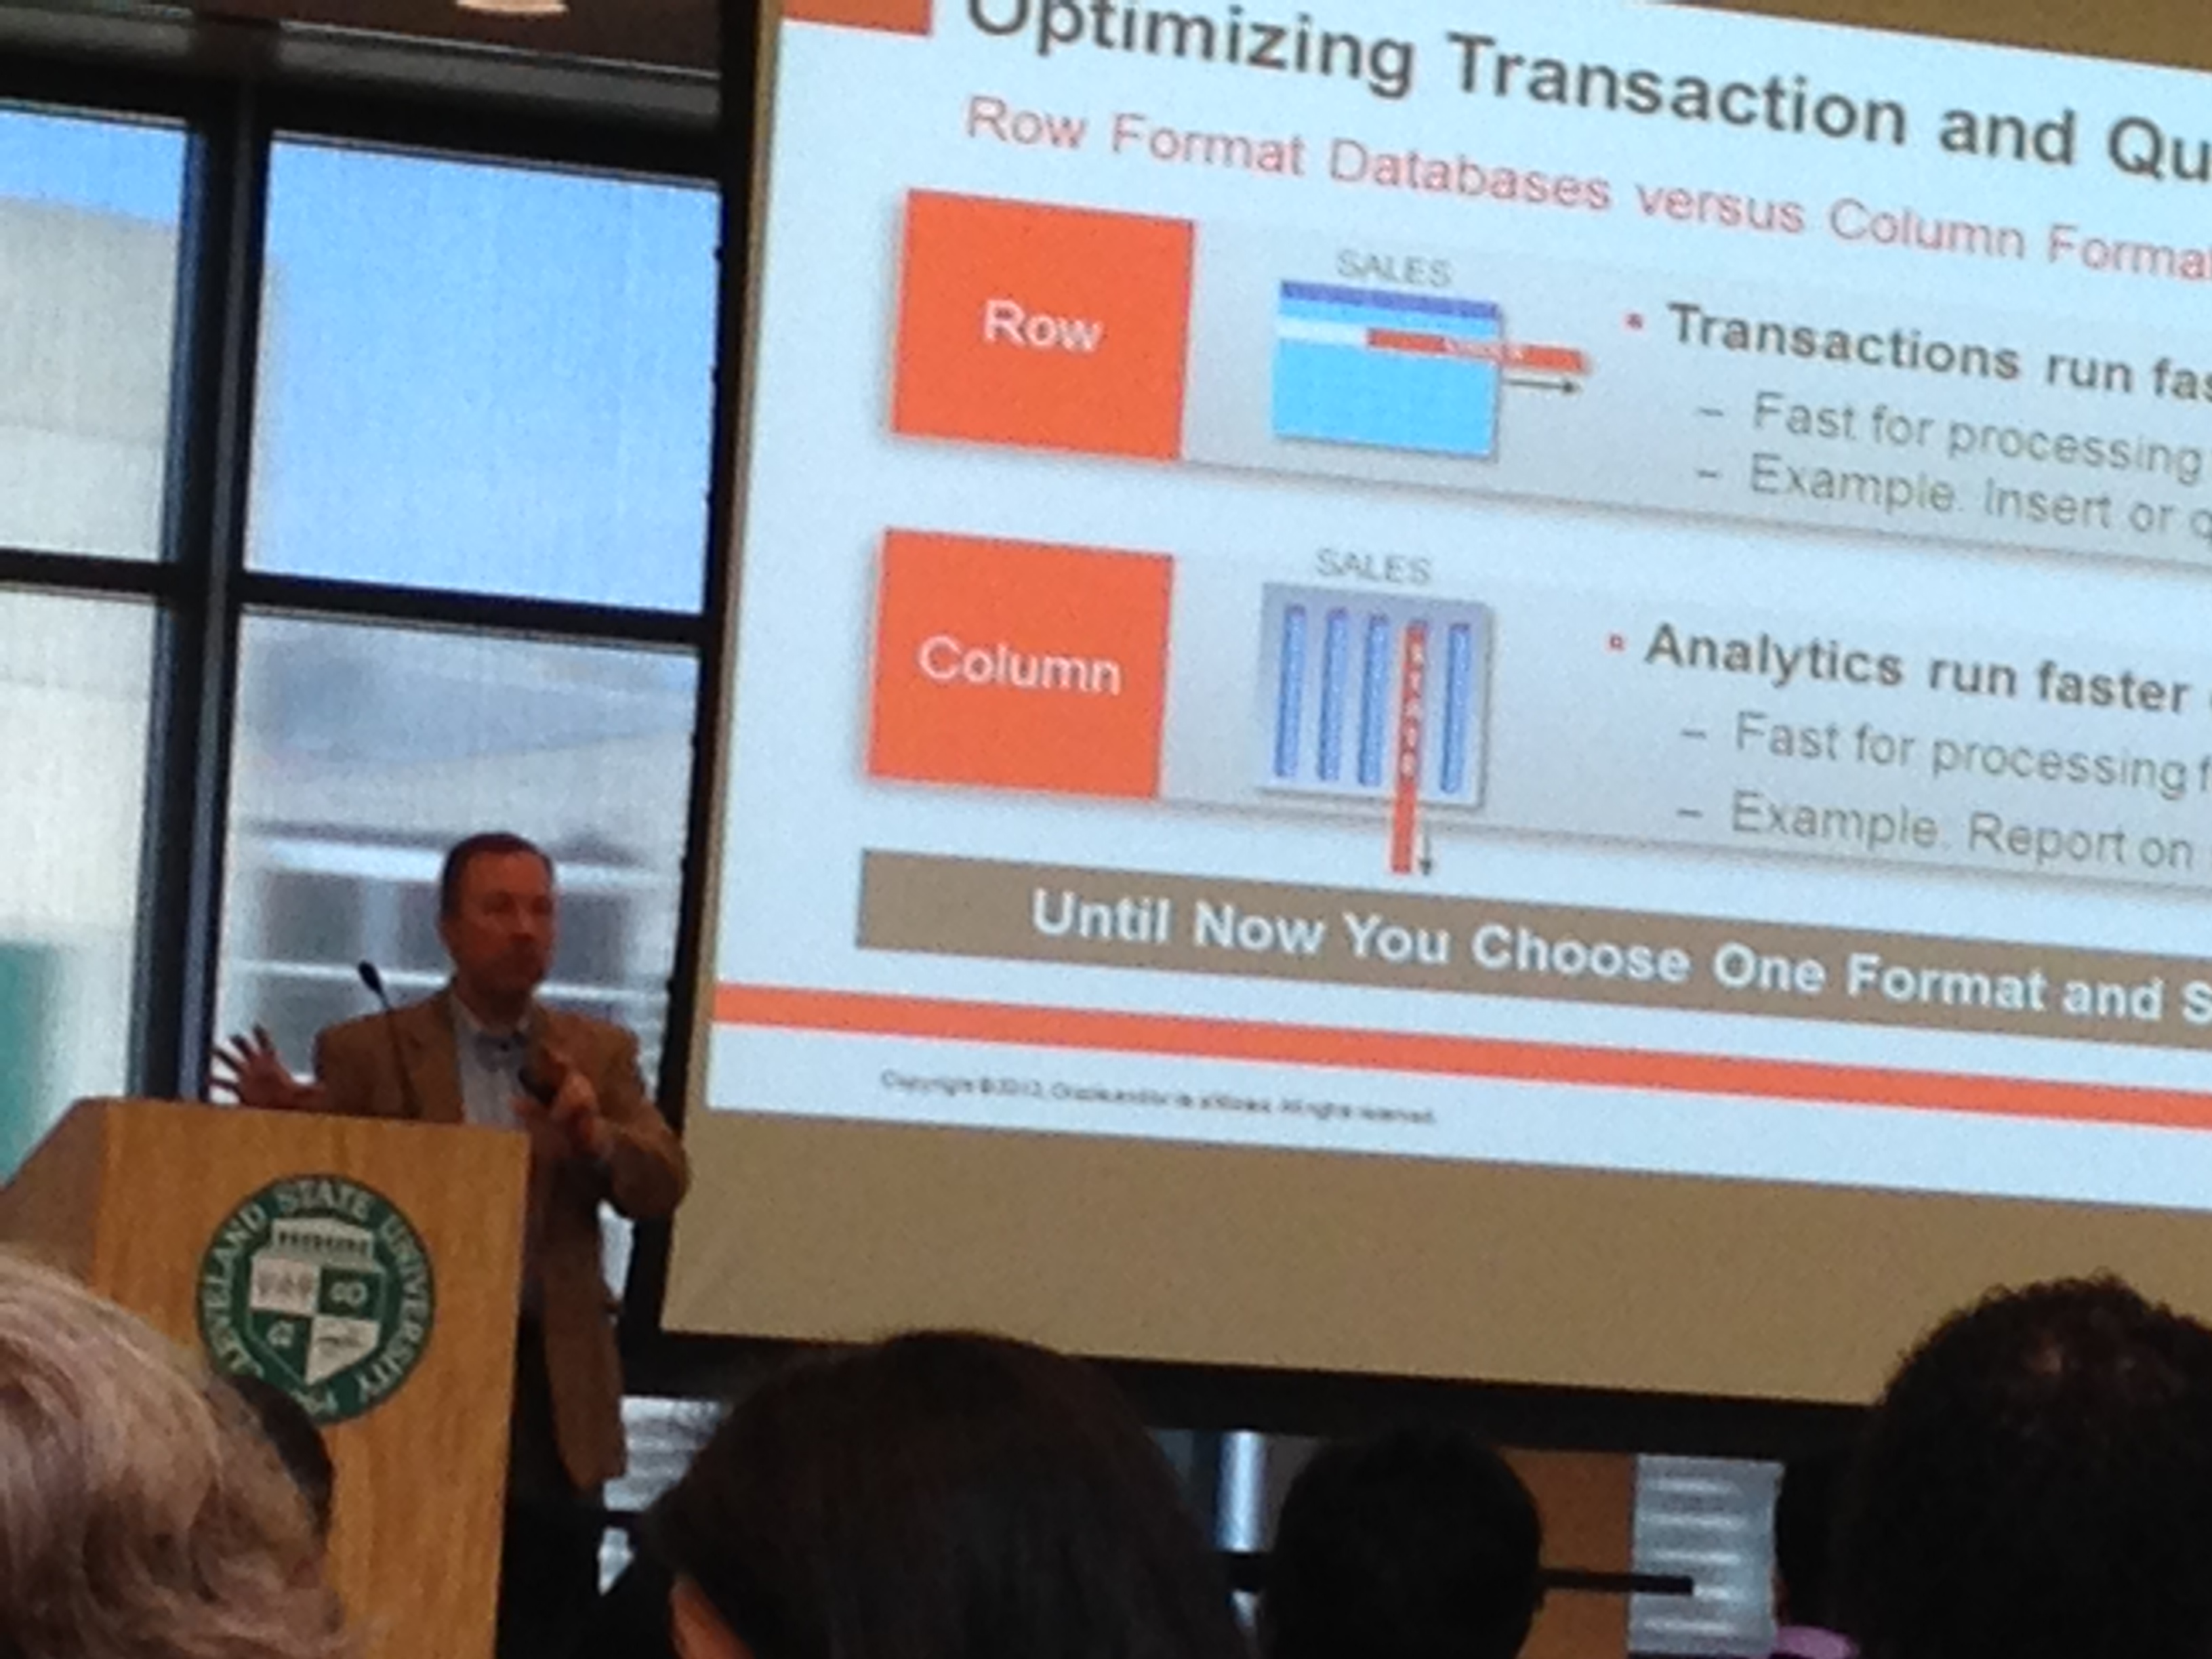
Great Lakes Oracle Conference GLOC May 12-14
Each Oracle Users Group has its own personality. This week I had the honor to co-speak with Mauro Pagano at GLOC, and the experience has been great! We delivered a 4 hours workshop on “Oracle Performance Tuning 101”. We talked about fundamentals and tools of the trade for both Database and SQL Tuning. It was really nice to have over 50 attendees and it was a challenge to keep them engaged for such a long time! Still the feedback was: we want more!
Anyways, as I am listening to Tom Kyte speaking about the new Oracle In-memory Database, I take a moment to write some words about this GLOC. What can I say? In short: It has been awesome! This Oracle Users Group is well organized and growing slowly for surely (over 300 attendees). This is my second year speaking at GLOC and I see it bigger, better and very welcoming. As far as I understand, membership is inexpensive and still manages to attract such good speakers as Tom Kyte, Alex Gorbachev, Scott Spendolini, Tim Gorman, Kyle Hailey, Steven Feuerstein, Carol Dacko, Ric Van Dyke and many others. My kudos to GLOC. Way to go! Looking forward to contribute again next year, and hoping to see more speakers and attendees traveling from other Regions.
Why using SQLTXPLAIN
Every so often I see on a distribution list a posting that starts like this: “I upgraded my application from database release X to release Y and now many queries are performing poorly, can you tell why?”
As everyone else on a distribution list, my first impulse is to make an educated guess permeated by a prior set of experiences. The intentions are always good, but the process is painful and time consuming. Many of us have seen this kind of question, and many of us have good hunches. Still I think our eagerness to help blinds us a bit. The right thing to do is to step back and analyze the facts, and I mean all the diagnostics supporting the observation.
What is needed to diagnose a SQL Tuning issue?
The list is large, but I will enumerate some of the most important pieces:
- SQL Text
- Version of the database (before and after upgrade)
- Database parameters (before and after)
- State of the CBO Statistics (before and after)
- Changes on Histograms
- Basics about the architecture (CPUs, memory, etc.)
- Values of binds if SQL has them
- Indexes compare, including state (visible?, usable?)
- Execution Plan (before and after)
- Plan stability? (Stored Outlines, Profiles, SQL Plan Management)
- Performance history as per evidence on AWR or StatsPack
- Trace from Event 10053 to understand the CBO
- Trace from Event 10046 level 8 or 12 to review Waits
- Active Session History (ASH) if 10046 is not available
I could keep adding bullets to the list, but I think you get the point: There are simply too many things to check! And each takes some time to collect. More important, the state of the system changes overtime, so you may need to re-collect the same diagnostics more than once.
SQLTXPLAIN to the rescue
SQLT or SQLTXPLAIN, has been available on MetaLink (now MOS) under note 215187.1 for over a decade. In short, SQLT collects all the diagnostics listed above and a lot more. That is WHY Oracle Support uses it every day. It simply saves a lot of time! So, I always encourage fellow Oracle users to make use of the FREE tool and expedite their own SQL Tuning analysis. When time permits, I do volunteer to help on an analysis. So, if you get to read this, and you want to help yourself while using SQLT but feel intimidated by this little monster, please give it a try and contact me for assistance. If I can help, I will, if I cannot, I will let you know.
Conclusion
It is fun to guess WHY a SQL is not performing as expected, and trying different guesses is educational but very time consuming. If you want to actually find root causes before trying to fix your SQL, you may want to collect relevant diagnostics. SQLT is there to help, and if installing this tool is not something you can do in a short term, consider then SQL Health-Check SQLHC.
What is new with EDB360?
Many things, but most important is that it got bigger and better. This EDB360 free tool provided is maturing over time. Its core function has not changed although, which is to present a 360-degree view of a database (10g or higher).
EDB360 is a nice complement to other tools like Exacheck, Raccheck or Oracheck. It has some additional benefits, like taking a snapshot of a system to then be analyzed offline or simply to preserve this snapshot as a baseline.
Keep in mind that EDB360 does not install anything on the database, nor it changes any data on it. In some cases, where direct access to the database server is not an option, having the capability of executing EDB360 through a SQL*Plus client connection is a big plus.
I use EDB360 as a starting place to perform a whole database health-check.
Since pictures tell more than words, please find below 4. The first two are about the new entries on EDB360 main menu (menu is a tad bigger than what you see in these two pictures, and its content is dynamic). The last two pictures are just a sample of the charts that are now part of EDB360.
EDB360 execution parameters changed from 4 to 6:
- Oracle Pack License: If your site has the Tuning Pack, then enter ‘T’, else if your site has the Diagnostics Pack enter ‘D’, else enter ‘N’.
- Days of History to consider. If you entered ‘T’ or ‘D’ on first parameter, then specify on 2nd parameter up to how many days of history you want EDB360 to use. By default it uses 31, assuming your AWR history is at least that big.
- Do you want HTML Reports? By default it is ‘Y’.
- Do you want Text Reports? Defaults to ‘Y’.
- Do you want CSV Files? Defaults to ‘Y’.
- Do you want Charts? Defaults to ‘Y’.
Once you login into SQL*Plus while on top of the edb360 directory, simply execute script edb360.sql and pass all 6 parameters one by one or all of them inline. For example: @edb360 T 31 Y Y Y Y
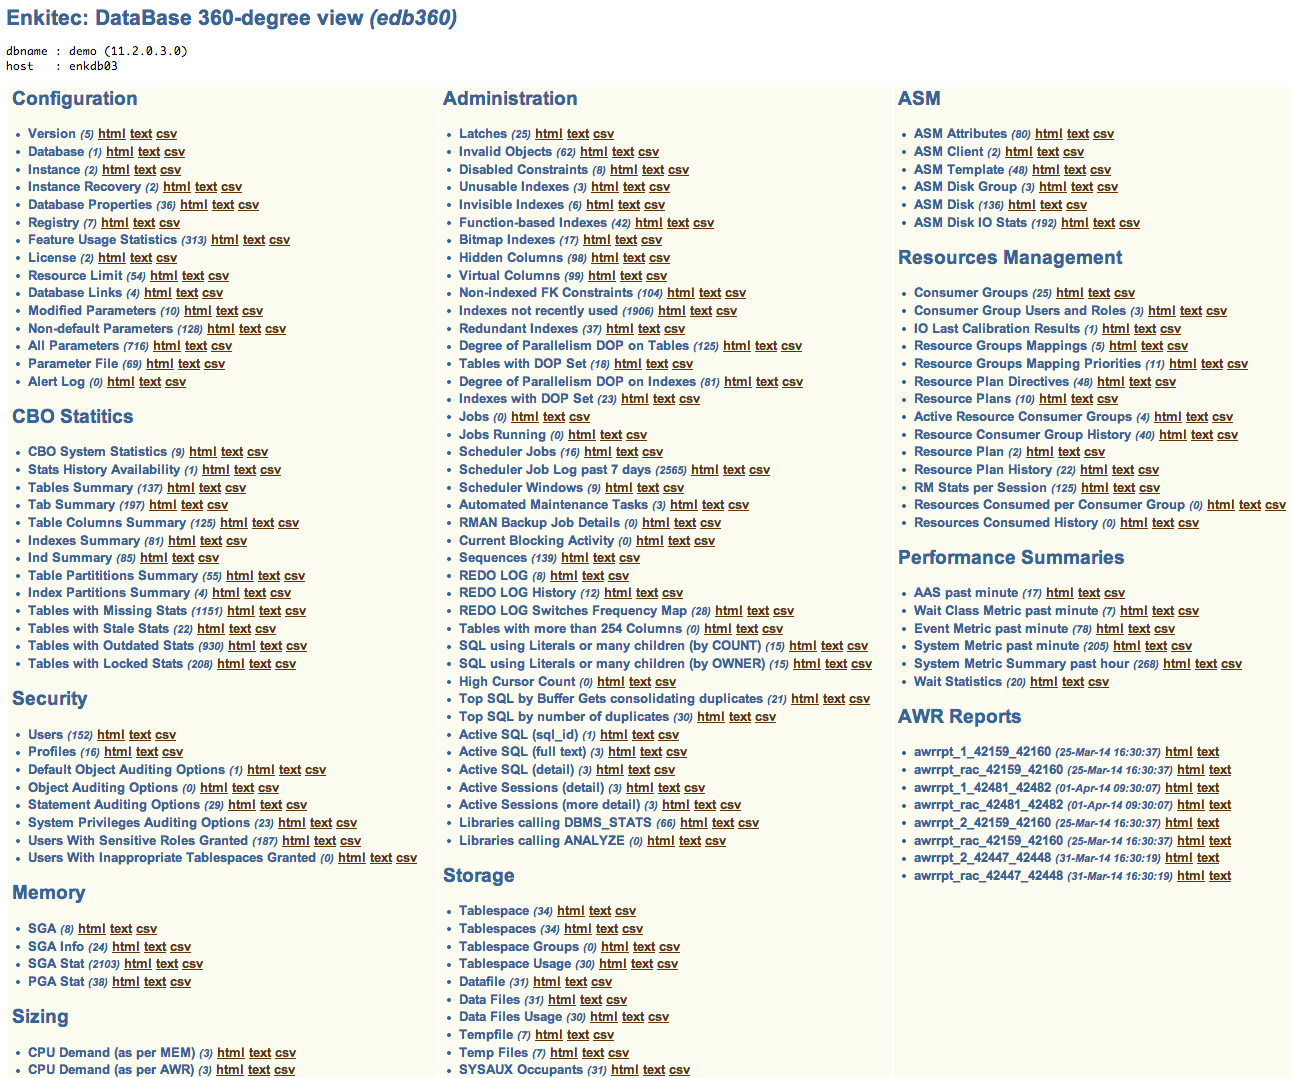
EDB360 Dynamic Menu (part 1)
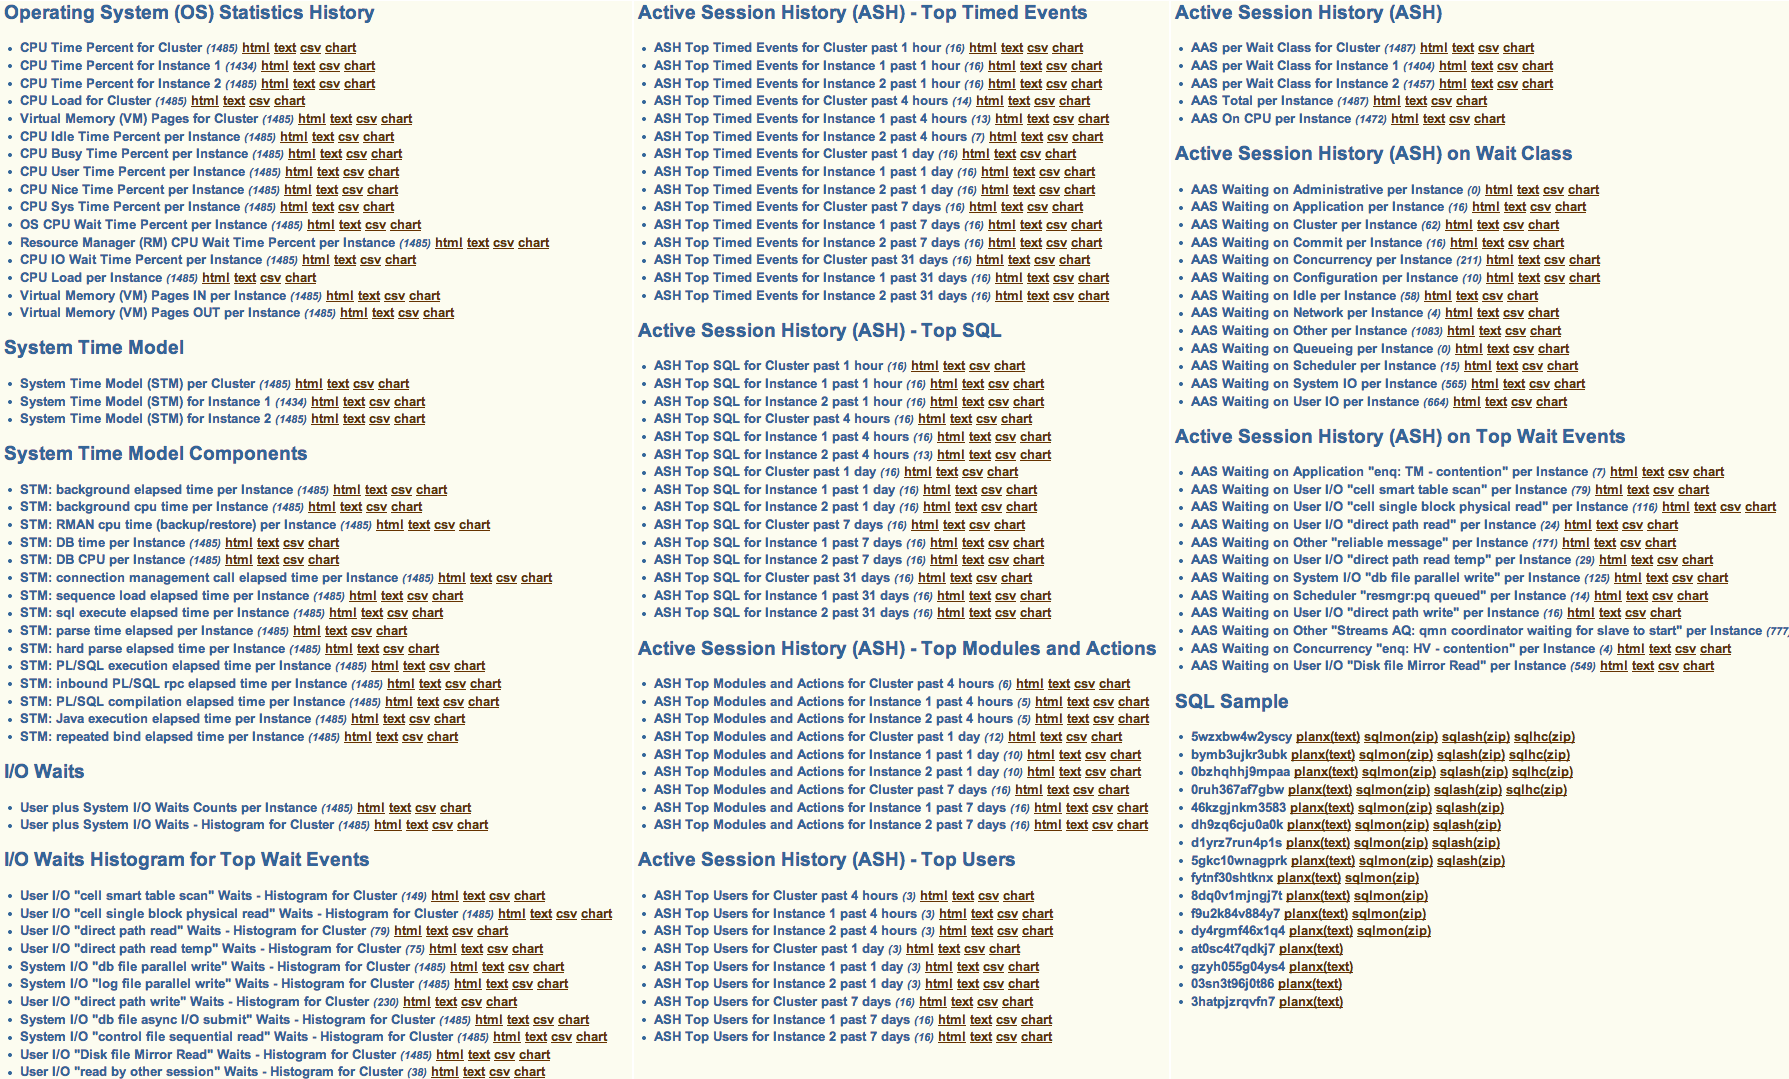
EDB360 Dynamic Menu (part 2)
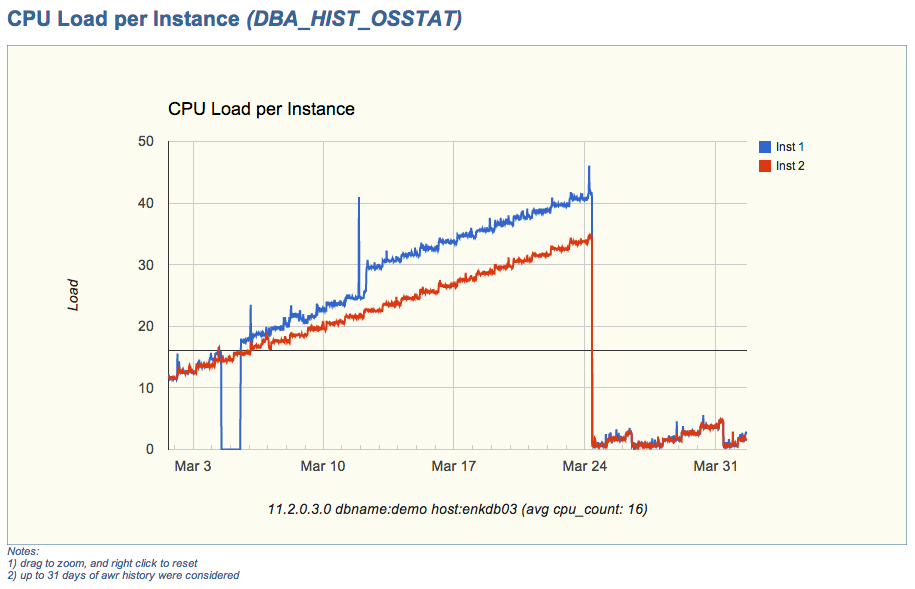
CPU Load per Instance (sample chart)
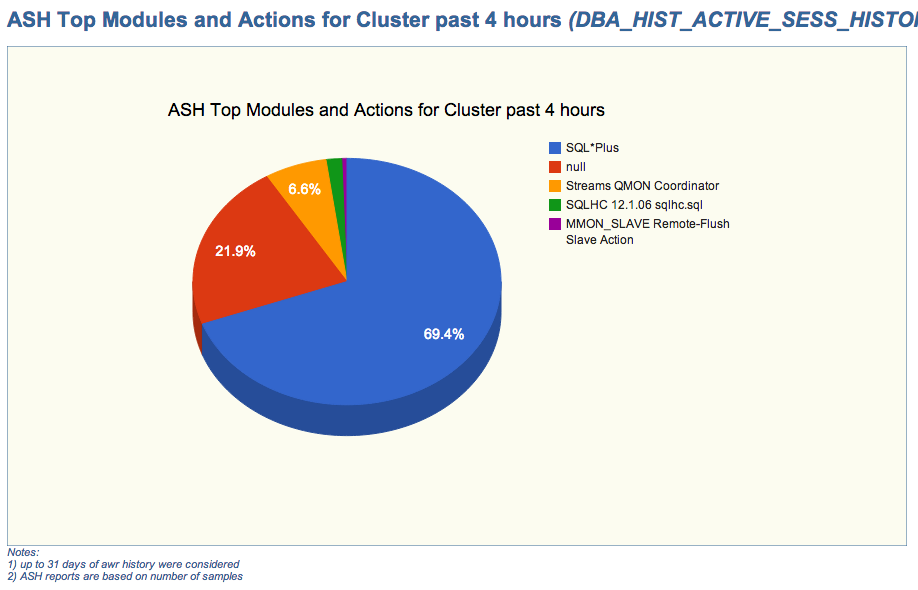
ASH Top Modules and Actions for Cluster (sample chart)
If you have downloaded EDB360 before, then I encourage you to download and test the new version. If you have never used it, I hope you find this tool useful.
Enkitec’s free AWR data mining tool (eAdam) is now available!
As of today, you can download this free tool out of our Enkitec‘s web page. Just select “eAdam” under the Products Tab.
The next version of eAdam will incorporate the GV$views, equivalent to the currently extracted DBA_HIST set. The reason of this enhancement is to handle read-only databases (DataGuard – DG). So views like GV$ACTIVE_SESSION_HISTORY will be available for data mining within the eAdam staging repository.
Any ways, I hope you enjoy this new tool. Feel free to provide constructive feedback on this blog, or by sending an email to carlos.sierra@enkitec.com.
Meet: eAdam – Enkitec’s free AWR data mining tool
You recently learned about eDB360, and now eAdam? What is this eAdam tool? Before you continue reading, please be aware that eAdam reads data from AWR, thus you must have a license for the Oracle Diagnostics Pack in order to use this new eAdam tool.
Introduction
New eAdam is a free tool to perform data mining on performance related historical data recorded by AWR. The main characteristics of eAdam are:
- Installs nothing on the Source database (usually Production)
- Extracts AWR performance related data as plain text flat files (no export or data pump binary files)
- Upload extracted AWR data into a Staging database of same or different platform and release
- Data mining is performed on the Staging database instead of Production
How does eAdam work?
It is better to explain eAdam by functions. So I would say eAdam has the following 4 modules:
- AWR extraction from Source (Production)
- eAdam installation on Staging system
- Loading into eAdam Stage a set of AWR files extracted from Source
- AWR data mining on eAdam Stage
AWR extraction from Source (Production)
This is the simplest part. You just need to execute a simple and short script on a Source system (usually Production). This script extracts into flat files the content of the following AWR views. Then it compresses them into a TAR file. List below may expand over time as new eAdam versions become available.
DBA_HIST_ACTIVE_SESS_HISTORY
DBA_HIST_DATABASE_INSTANCE
DBA_HIST_DATAFILE
DBA_HIST_DLM_MISC
DBA_HIST_EVENT_HISTOGRAM
DBA_HIST_FILESTATXS
DBA_HIST_IOSTAT_DETAIL
DBA_HIST_IOSTAT_FILETYPE
DBA_HIST_IOSTAT_FUNCTION
DBA_HIST_OSSTAT
DBA_HIST_PGASTAT
DBA_HIST_SERVICE_STAT
DBA_HIST_SGA
DBA_HIST_SGASTAT
DBA_HIST_SNAPSHOT
DBA_HIST_SQL_PLAN
DBA_HIST_SQLSTAT
DBA_HIST_SQLTEXT
DBA_HIST_SYS_TIME_MODEL
DBA_HIST_SYSSTAT
DBA_HIST_SYSTEM_EVENT
DBA_HIST_TEMPFILE
DBA_HIST_TEMPSTATXS
eAdam installation on Staging system
You install eAdam once and then use it multiple times. If you download a newer version just install it on top of the prior one, so you get the eAdam delta. eAdam should be installed on a Staging database and not in Production or UAT. Pretty much any database could be your Staging database (QA or any other lower environment). It could even be a database on your laptop for example. Your Staging database does not have to be the same platform or database release than Source.
To install eAdam you simply execute another script. It creates a schema (you provide the name and password), and this script creates the eAdam repository on your Staging database.
Loading into eAdam Stage a set of AWR files extracted from Source
You can load into eAdam as many TAR files as you want. Each set is identified within eAdam with a sequence key. So your eAdam repository can contain AWR data from different systems, and they could be from same or different platforms and database releases. The data model of your eAdam repository is determined from your Staging database release, so it is ideal your Staging database is of equal or higher release than your Sources, but this is not mandatory.
To load a TAR file with AWR data into your Staging eAdam repository, you execute another script that asks for the TAR name and it produces a set of External Tables, then uploads the AWR data from the temporary external Tables into permanent staging Tables:
DBA_HIST_ACTIVE_SESS_HIST_S
DBA_HIST_DATABASE_INSTANC_S
DBA_HIST_DATAFILE_S
DBA_HIST_DLM_MISC_S
DBA_HIST_EVENT_HISTOGRAM_S
DBA_HIST_FILESTATXS_S
DBA_HIST_IOSTAT_DETAIL_S
DBA_HIST_IOSTAT_FILETYPE_S
DBA_HIST_IOSTAT_FUNCTION_S
DBA_HIST_OSSTAT_S
DBA_HIST_PGASTAT_S
DBA_HIST_SERVICE_STAT_S
DBA_HIST_SGASTAT_S
DBA_HIST_SGA_S
DBA_HIST_SNAPSHOT_S
DBA_HIST_SQLSTAT_S
DBA_HIST_SQLTEXT_S
DBA_HIST_SQL_PLAN_S
DBA_HIST_SYSSTAT_S
DBA_HIST_SYSTEM_EVENT_S
DBA_HIST_SYS_TIME_MODEL_S
DBA_HIST_TEMPFILE_S
DBA_HIST_TEMPSTATXS_S
DBA_HIST_XTR_CONTROL_S
DBA_TAB_COLUMNS_S
AWR Data mining on eAdam Stage
Once your AWR is available inside eAdam, you can perform all the Data Mining you may need. A sample script that produces several CSV files out of your data is provided. This sample script is automatically executed at the end of your upload, so you get a set of CSV files that can be used on Excel or any other tool that reads CSV files. I use Excel, where I can easily generate Charts out of the CSV files created by the sample script. That means I can easily visualize trends out of performance data without having access to the Source (Production) environment.
To produce the sample CSV files, eAdam provides a set of views on top of its own repository. These set of views will evolve over time as new releases become available. As of 1st release we provide the following views:
SH_AAS_APPLICATION_V1
ASH_AAS_CLUSTER_V1
ASH_AAS_COMMIT_V1
ASH_AAS_CONCURRENCY_V1
ASH_AAS_ON_CPU_V1
ASH_AAS_OTHER_V1
ASH_AAS_SCHEDULER_V1
ASH_AAS_TOTAL_V1
ASH_AAS_USER_IO_V1
ASH_INST_V1
ASH_RAC_V1
EVENT_HISTOGRAM_INST_V1
EVENT_HISTOGRAM_IO_RAC_V1
EVENT_HISTOGRAM_RAC_V1
EVENT_HISTOGRAM_RAC_V2
OSSTAT_BUSY_TIME_PERC_V1
OSSTAT_DELTA_V1
OSSTAT_INST_V1
OSSTAT_LOAD_V1
OSSTAT_RAC_V1
SYSTEM_EVENT_DELTA_V1
SYSTEM_EVENT_INST_V1
SYSTEM_EVENT_NON_IDLE_V1
SYSTEM_EVENT_RAC_V1
SYS_TIME_MODEL_DB_CPU_V3
SYS_TIME_MODEL_DB_TIME_V3
SYS_TIME_MODEL_DB_WAIT_V3
SYS_TIME_MODEL_DELTA_V1
SYS_TIME_MODEL_INST_V1
SYS_TIME_MODEL_RAC_V1
FAQ
Q1: Where can I download eAdam?
A1: From the Enkitec web page. Click on the “Products” tab. The tool will be available on March 7, 2014.
Q2: Is it really free?
A2: Yes. And before you ask what is the catch: “there is no catch”. Just be aware you must have an Oracle Diagnostics Pack license in order to access AWR data, and this eAdam tool is not an exception. Besides that, eAdam is free to download and use.
Q3: I need some extra functionality. How do I get it?
A3: If you need something that eAdam does not provide out of the box, of course you can extend its functionality directly. If the addition is something of general interest, you can submit an “Enhancement Request” (an email actually or a comment on this post). But it you want something more advanced and of particular use, you can contact Enkitec for a quote for this customization on top of eAdam (for example an Apex application).
Q4: Can I share this eAdam tool or its output?
A4: Sure you can. Just credit Enkitec for the tool. In other words, use it any way you want, but please honor authorship and ownership.
Q5: Who “owns” eAdam?
A5: Enkitec owns this new tool. Carlos Sierra is the author of eAdam, but the vision and some critical components were provided by: Frits Hoogland, Karl Arao and Randy Johnson. So eAdam is the product of a collaboration effort of some geeks working for Enkitec.
Conclusion
Enkitec is providing this eAdam tool for AWR Data Mining for free. Having an Oracle Diagnostics Pack is a must before using this tool. Besides that, feel free to use this tool at will, and perform all your AWR Data Mining outside the Source system, which is very important for a Production environment. This eAdam is very resource conscious on the Source system, and it empowers anyone to do performance analysis without having direct access to the Source database.
Having an AWR repository created with eAdam, enables many possibilities, like having baselines for particular processes, or compare performance between different time intervals (pre and post an application upgrade for example) or between two different systems (UAT and Production for example). If you already have a set of scripts to do data mining on DBA_HIST views, you can easily convert them to use the matching eAdam Staging tables so you would no longer be constrained to connect to the live system.
Performing Data Mining in entities like ASH as stored by AWR is like digging in a gold mine. There is so much the database wants to tell you. You just need this kind of of tool to listen carefully and find what is important.
Meet “edb360”: a free tool that provides a 360-degree view of an Oracle database
Simply put: edb360 is a new free tool that provides a 360-degree view of an Oracle database.
What is “edb360“?
This “edb360” tool is the product of a collaborative effort of some very smart guys, and me. Special thanks to Frits Hoogland, Karl Arao, Randy Johnson, Martin Bach, Kyle Hailey, Tanel Poder, Alex Fatkulin, Mauro Pagano, Abel Macias, Jon Adams and Jack Agustin. These guys helped me to envision edb360, some directly and some indirectly, but their help and shared knowledge motivated me to develop edb360 and make it available today.
The edb360 tool started as a quick and dirty “script” to gather basic information about a database without knowing anything about it before hand. The first rule for edb360 was: it has to install nothing in the database. The second rule became: it has to provide some insight about a database.
The output is presented for the most part into 3 formats: HTML, Text and Comma-separated Values (CSV). Why? HTML and Text can be easily used to consolidate important findings into a Word report. Sometimes HTML is more useful and sometimes Text is better. Then CSV is used to produce charts out of Performance Trends. Some people can visualize trends easier with a graph (me included).
What about other tools?
Of course there are wonderful tools that can help in this arena, like Oracle Enterprise Manager (OEM) or Oracle’s Automatic Workload Repository (AWR). So why not using those tools? Well, if I had access to OEM or I knew before hand which time intervals I want to analyze with AWR, then I would not have a strong need to use edb360. The reality that we consultants face when we are getting acquainted of a system, is that we are not given any access to the database of interest (usually production). And asking for a server account feels like asking for coke’s secret formula: then we simply cannot poke the database at our own will, and that is understandable. So, what is our second best?: please run this script that installs nothing and generates a zip file with some metadata from your system. The script is plain text and its output is also plain text (html, text and csv files). So, any DBA or System Administration can validate that no customer confidential data is extracted or exposed. A win-win!
If the system we want to understand is an Exadata system, we can also request for an Exacheck output, if not an Exadata system but a RAC cluster, there is Raccheck. These two tools, available though My Oracle Support (MOS) make a good companion for the edb360. In other words, edb360 is not a replacement for the other two but more of an add-on or companion.
Why is edb360 free?
Why not? Often I get asked: why do you give away the tools and scripts you develop? The answer is simple: tools, scripts, white papers, blog entries like this, in my mind they all represent the same: sharing knowledge with our Oracle community. I wish for a community where knowledge (and tools) flows for all to benefit. Let’s say my personal time I invest building tools and scripts kinds of make it up for my lame blog postings. 😉
What is the catch?
No catch. Just be aware that edb360 makes use of some DBA_HIST views and ASH data, and those are part of the Oracle Diagnostics Pack. So when executing the tool it will ask to indicate if your site has those licenses. Your answer determines the scope of the output. So if you specify you have a license for the Oracle Diagnostics Pack then your edb360 output includes pieces from AWR and ASH, else AWR and ASH are not accessed.
About versions, feedback and support
For the most part, I am committed to maintain this tool as my personal time permits. That means I can only work on it during odd hours and not every day. Nothing different than SQLTXPLAIN during the first few years of its existence, so I am not scared. Keep also in mind this edb360 is work in progress, and version v1405 is the first one I feel comfortable sharing with the community. In other words, it is far from perfect and I foresee it growing in multiple directions.
If you like this tool, and want to enhance its output, get SQLHC from MOS 1366133.1, and place the sqlhc.sql script into the same db360/sql directory. By doing so, you will also get 3 SQL health-checks. In other words, edb360 is SQLHC aware.
Conclusion
If you like free tools and have a use for this edb360 tool, you might as well download it and give it a shot. Nothing to lose (besides a few minutes of your spare time). A sample output is also available under same link above.
Life is Good!
About AWR, SQLT and DB360
This blog posting is about answering this first question below, which I often get asked:
Can I use SQLTXPLAIN (SQLT) instead of AWR?
The answer is: it depends. If you are doing SQL Tuning and you already know the SQL_ID, then you may want to use SQLT XTRACT (MOS 215187.1) directly on the SQL_ID of concern. But even in that case, keep in mind that SQLT accesses AWR data, so your environment must have a valid license to use the Oracle Diagnostics Pack. In fact, when you install SQLT, it asks if you have the Oracle Tuning Pack, the Oracle Diagnostics Pack or none. Depending how you respond, SQLT access or not the set of views and APIs included on those Oracle Packs. That means you can configure SQLT to access or not AWR data.
What is the difference between AWR and SQLT?
In short, the difference between these two is the scope. You use AWR to diagnose database performance, while you use SQLT to diagnose one SQL. Sometimes I explain this difference by saying: “AWR is to an entire database to what SQLT is to one SQL”. One is for system-wide performance, the other is very centric to one SQL at a time.
Why SQLT exists?
I envisioned SQLT on the late 90’s when I was a road-warrior fighting fires in the area of performance, and in particular SQL performance. I found back then that Oracle-provided tools like TKPROF were excellent, but I always needed something more, like knowing the state of the CBO Statistics, Tables and Indexes, etc.
These days, my good friend Mauro Pagano from Oracle, is keeping the ball rolling. He is keeping SQLT in constant motion, making it a better tool on every new version. So, I would say this: SQLT is filling up some gaps that me, and many others, consider important in order to be diligent on root cause analysis for cases were a SQL performs poorly.
What is DB360?
As SQLT brings to the table several pieces of information that we need for SQL Tuning, and which are not available using out-of-the-box tools like TKPROF or SQL Monitoring, the new DB360 tool is doing something similar for the entire database: It complements what AWR provides by producing a report with meaningful information about an entire database. This DB360 is a tool that installs nothing on the database, and produces an HTML report with sections such as Configuration, Sizing, CBO Statistics, Performance Trends, etc.
Is DB360 a licensed product?
No. This DB360 tool belongs to Enkitec. It is not yet available to the Oracle community, but it will be soon. Same as SQLT, if you have an Oracle Tuning or Diagnostics Pack, then when you execute DB360 you would get to see in your DB360 report some pieces of information generated out of views and APIs covered by those Oracle Packs, else you get only the pieces which require no Oracle Pack license. Besides the restriction to limit your use of DB360 as per your Oracle Pack license, DB360 itself will be available to the Oracle community for free, and with no strings attached, same as SQLT.
Why are SQLT and DB360 free to download and use?
These tools are simply a contribution to the Oracle community. “Sharing tools is like sharing knowledge: it makes our IT experience more pleasurable”. The only payback comes when you share back with the Oracle community some of your knowledge, or some of your tools and scripts. If you have been a speaker in an Oracle Users Groups, then you may relate to this gratifying experience to share with others what you know. At RMOUG these past 3 days, I have had the opportunity to experience once again this special sense of community, that is always eager to share and to learn from each other.
Conclusion
SQLT complements TKPROF and SQL Monitor. DB360 complements AWR. When it comes to diagnostics, either for one SQL or for an entire Database, having to our disposal additional diagnostics in the context of our analysis, improves our chances to do a diligent job, while reducing the time that it would take to assembly those pieces manually; all with the extra benefit of having these extra diagnostics pieces consistent to a point in time. So, I hope you continue enjoying SQLT and in the near future DB360!
SQL using Literals instead of Binds. Are all Literals evil?
Every so often I see systems where there is a good amount of SQL that uses Literals instead of Binds, and executes enough times to create a large number of Cursors. Is this a red flag? As many questions regarding performance, I would say the right answer is: it all depends.
Of course we want to use Binds instead of Literals in order to reduce the frequency of Hard Parses, and in turn reduce CPU consumption and space utilization in the Shared Pool. Does it mean we want to replace all Literals with Binds? Do we declare war on Literals? In my opinion, the answer is simply: NO.
If a SQL has a Predicate on a date column, or a key column, then I would expect the Number of Distinct Values (NDV) for such column to be high, and in some cases as high as the number of rows in the Table (unique values for example). In the other hand, if the Predicate is in one of those columns that denotes a code, like Process Type or Status, and the NDV is small, then I’d rather keep the Literal in place. Specially if the data in such column is skewed and I have (or plan to have) Histograms on it.
What do I propose?
- If the SQL is executed sporadically, then it does not matter (Literals or Binds).
- If the SQL executes frequently, and the Predicate in question is on a Column where the Number of Distinct Values (NDV) is high, then use a Bind instead of a Literal (for this Predicate).
- If the SQL executes frequently, and the Predicate in question is on a Column where the NDV is low, then use a Literal (for this Predicate). This assumes the NDV for these Literals is also small.
- Regardless if using a Literal or a Bind for a particular Predicate: If the data in a Column referenced by a Predicate is heavily skewed, gather Statistics with Histograms on this Column.
Follow-up question: When the NDV is high or low? The answer is also: it all depends. I personally prefer to see Literals if the NDV for this Column (and this Literal) is less than 10 (or so).
Why having Binds and Literals on same SQL is better than having all Binds?
If we have good set of CBO Statistics, and we have Histograms on skewed data, and we are using bind peeking, and we are on 11g, and Adaptive Cursor Sharing (ACS) is enabled, and we plan using SQL Plan Management (SPM), then we are for a treat:
With all the “ands” above, by using Binds on predicates with high NDV and Literals in those with low NDV, then we will end up having a small number of different SQL_IDs for what we consider “the same SQL”. Each incarnation of this SQL could potentially have its own set of optimal Execution Plans created by ACS and the CBO (by making use of Histograms on the data and Selectivity Profiles on ACS). Then, with the aid of SPM we could provide stability to those multiple optimal Execution Plans for each version of the SQL. That means that SQL Q1 with Literal L1 could have a different set of optimal plans than Q1 with Literals L2.
Conclusion
Replacing some Literals with Binds but not all Literals sounds like a lot of work, but actually the extra work may be worth the effort. In my opinion, the end result is better if we replace most, but not all (as per proposal above). WHY? Even when ACS does a good job at finding multiple optimal plans for a SQL by using the selectivity of the predicates; by allowing a small number of cursors for the same SQL given the use of Literals in columns with low NDV, we are basically reducing the times we would have to execute a SQL with a sub-optimal plan due to current ACS ramp-up process. This extra granularity provided by a small number of incarnations of the “otherwise same SQL” could be crucial for tuning complex SQL or corner cases.
Exadata Optimizations and SQLTXPLAIN Courses
I will be delivering a couple of courses soon. One in January and the second in February. I will keep posting upcoming Training and Conferences on a new link at the right margin of this blog.
Exadata Optimizations Jan 13-14
This 2-days “Exadata Optimizations” course is for Developers and DBAs new to Exadata and in need to ramp-up quickly. As the name implies, its focus is on Exadata Optimizations. We talk about Smart Scans, Storage Indexes, Smart Flash Cache, Hybrid Columnar Compression (HCC) and Parallel Execution (PX). This course is hands-on, with a fair amount of demos and labs.
SQLTXPLAIN (SQLT) Feb 20-21
This “SQL Tuning with SQLTXPLAIN” 2-days course shows how to use SQLT to actually do SQL Tuning. We go over the ying-yang of the CBO, meaning: Plan Flexibility versus Plan Stability. We use SQLT for labs and we also go over some real-life SQL Tuning cases. If you are currently using SQLT, you are welcome to bring a SQLT Report to class and we could review it there.
Conclusion
New year, new resolutions. I will be investing part of my time sharing knowledge through formal courses and conferences. These days it is hard to find the time and budget to keep our knowledge on the edge, but again and again I see that many of our daily struggles could be mitigated by some concise technical training. So I encourage you to add some training to your list of resolutions for this new year; or at the very least, to get and read some fresh books.
Happy New Year 2014!
