Archive for the ‘SQL Tuning’ Category
Skipping ACS ramp-up using a SQL Patch
As I prepare for one of my sessions at ODTUG Kscope14 I came across the typical situation of having a SQL for which I wanted to produce multiple optimal execution Plans on an 11g environment. As you may know, with Adaptive Cursor Sharing (ACS) this is possible and automatic, but the problem is that sometimes the ACS ramp-up process causes some suboptimal Execution Plans. If you want to skip this ACS ramp-up process, lets say for a SQL that is part of a business-critical transaction and which is known to have unstable Plans, then you may want to create a SQL Patch with the BIND_AWARE Hint. Maria Colgan explained this method on this blog post. What I present here is a script I use, so I can easily implement SQL Patches for some SQL where I just need to inject one or two CBO Hints, like this BIND_AWARE. I use SQL Profiles or SQL Plan Management when I need to provide CBO Hints that affect access paths or join order, but if I just need something like skipping ACS ramp-up or a Hint to produce a SQL Monitor report, then I’d rather use SQL Patch.
Script below asks for SQL_ID and for a short list of CBO Hints to include. By default it includes these 3: “GATHER_PLAN_STATISTICS MONITOR BIND_AWARE”. Execute this script connecting as SYS.
----------------------------------------------------------------------------------------
--
-- File name:   sqlpch.sql
--
-- Purpose:     Create Diagnostics SQL Patch for one SQL_ID
--
-- Author:      Carlos Sierra
--
-- Version:     2013/12/28
--
-- Usage:       This script inputs two parameters. Parameter 1 the SQL_ID and Parameter 2
--              the set of Hints for the SQL Patch (default to GATHER_PLAN_STATISTICS
--              MONITOR BIND_AWARE).
--
-- Example:     @sqlpch.sql f995z9antmhxn BIND_AWARE
--
--  Notes:      Developed and tested on 11.2.0.3 and 12.0.1.0
--
---------------------------------------------------------------------------------------
SPO sqlpch.txt;
DEF def_hint_text = 'GATHER_PLAN_STATISTICS MONITOR BIND_AWARE';
SET DEF ON TERM OFF ECHO ON FEED OFF VER OFF HEA ON LIN 2000 PAGES 100 LONG 8000000 LONGC 800000 TRIMS ON TI OFF TIMI OFF SERVEROUT ON SIZE 1000000 NUMF "" SQLP SQL>;
SET SERVEROUT ON SIZE UNL;
COL hint_text NEW_V hint_text FOR A300;
SET TERM ON ECHO OFF;
PRO
PRO Parameter 1:
PRO SQL_ID (required)
PRO
DEF sql_id_1 = '&1';
PRO
PRO Parameter 2:
PRO HINT_TEXT (default: &&def_hint_text.)
PRO
DEF hint_text_2 = '&2';
PRO
PRO Values passed:
PRO ~~~~~~~~~~~~~
PRO SQL_ID   : "&&sql_id_1."
PRO HINT_TEXT: "&&hint_text_2." (default: "&&def_hint_text.")
PRO
SET TERM OFF ECHO ON;
SELECT TRIM(NVL(REPLACE('&&hint_text_2.', '"', ''''''), '&&def_hint_text.')) hint_text FROM dual;
WHENEVER SQLERROR EXIT SQL.SQLCODE;

-- trim sql_id parameter
COL sql_id NEW_V sql_id FOR A30;
SELECT TRIM('&&sql_id_1.') sql_id FROM DUAL;

VAR sql_text CLOB;
VAR sql_text2 CLOB;
EXEC :sql_text := NULL;
EXEC :sql_text2 := NULL;

-- get sql_text from memory
DECLARE
  l_sql_text VARCHAR2(32767);
BEGIN -- 10g see bug 5017909
  FOR i IN (SELECT DISTINCT piece, sql_text
              FROM gv$sqltext_with_newlines
             WHERE sql_id = TRIM('&&sql_id.')
             ORDER BY 1, 2)
  LOOP
    IF :sql_text IS NULL THEN
      DBMS_LOB.CREATETEMPORARY(:sql_text, TRUE);
      DBMS_LOB.OPEN(:sql_text, DBMS_LOB.LOB_READWRITE);
    END IF;
    l_sql_text := REPLACE(i.sql_text, CHR(00), ' '); -- removes NUL characters
    DBMS_LOB.WRITEAPPEND(:sql_text, LENGTH(l_sql_text), l_sql_text);
  END LOOP;
  -- if found in memory then sql_text is not null
  IF :sql_text IS NOT NULL THEN
    DBMS_LOB.CLOSE(:sql_text);
  END IF;
EXCEPTION
  WHEN OTHERS THEN
    DBMS_OUTPUT.PUT_LINE('getting sql_text from memory: '||SQLERRM);
    :sql_text := NULL;
END;
/

SELECT :sql_text FROM DUAL;

-- get sql_text from awr
DECLARE
  l_sql_text VARCHAR2(32767);
  l_clob_size NUMBER;
  l_offset NUMBER;
BEGIN
  IF :sql_text IS NULL OR NVL(DBMS_LOB.GETLENGTH(:sql_text), 0) = 0 THEN
    SELECT sql_text
      INTO :sql_text2
      FROM dba_hist_sqltext
     WHERE sql_id = TRIM('&&sql_id.')
       AND sql_text IS NOT NULL
       AND ROWNUM = 1;
  END IF;
  -- if found in awr then sql_text2 is not null
  IF :sql_text2 IS NOT NULL THEN
    l_clob_size := NVL(DBMS_LOB.GETLENGTH(:sql_text2), 0);
    l_offset := 1;
    DBMS_LOB.CREATETEMPORARY(:sql_text, TRUE);
    DBMS_LOB.OPEN(:sql_text, DBMS_LOB.LOB_READWRITE);
    -- store in clob as 64 character pieces
    WHILE l_offset < l_clob_size
    LOOP
      IF l_clob_size - l_offset > 64 THEN
        l_sql_text := REPLACE(DBMS_LOB.SUBSTR(:sql_text2, 64, l_offset), CHR(00), ' ');
      ELSE -- last piece
        l_sql_text := REPLACE(DBMS_LOB.SUBSTR(:sql_text2, l_clob_size - l_offset + 1, l_offset), CHR(00), ' ');
      END IF;
      DBMS_LOB.WRITEAPPEND(:sql_text, LENGTH(l_sql_text), l_sql_text);
      l_offset := l_offset + 64;
    END LOOP;
    DBMS_LOB.CLOSE(:sql_text);
  END IF;
EXCEPTION
  WHEN OTHERS THEN
    DBMS_OUTPUT.PUT_LINE('getting sql_text from awr: '||SQLERRM);
    :sql_text := NULL;
END;
/

SELECT :sql_text2 FROM DUAL;
SELECT :sql_text FROM DUAL;

-- validate sql_text
BEGIN
  IF :sql_text IS NULL THEN
    RAISE_APPLICATION_ERROR(-20100, 'SQL_TEXT for SQL_ID &&sql_id. was not found in memory (gv$sqltext_with_newlines) or AWR (dba_hist_sqltext).');
  END IF;
END;
/

PRO generate SQL Patch for SQL "&&sql_id." with CBO Hints "&&hint_text."
SELECT loaded_versions, invalidations, address, hash_value
FROM v$sqlarea WHERE sql_id = '&&sql_id.' ORDER BY 1;
SELECT child_number, plan_hash_value, executions, is_shareable
FROM v$sql WHERE sql_id = '&&sql_id.' ORDER BY 1, 2;

-- drop prior SQL Patch
WHENEVER SQLERROR CONTINUE;
PRO ignore errors
EXEC DBMS_SQLDIAG.DROP_SQL_PATCH(name => 'sqlpch_&&sql_id.');
WHENEVER SQLERROR EXIT SQL.SQLCODE;

-- create SQL Patch
PRO you have to connect as SYS
BEGIN
  SYS.DBMS_SQLDIAG_INTERNAL.I_CREATE_PATCH (
    sql_text    => :sql_text,
    hint_text   => '&&hint_text.',
    name        => 'sqlpch_&&sql_id.',
    category    => 'DEFAULT',
    description => '/*+ &&hint_text. */'
  );
END;
/

-- flush cursor from shared_pool
PRO *** before flush ***
SELECT inst_id, loaded_versions, invalidations, address, hash_value
FROM gv$sqlarea WHERE sql_id = '&&sql_id.' ORDER BY 1;
SELECT inst_id, child_number, plan_hash_value, executions, is_shareable
FROM gv$sql WHERE sql_id = '&&sql_id.' ORDER BY 1, 2;
PRO *** flushing &&sql_id. ***
BEGIN
  FOR i IN (SELECT address, hash_value
              FROM gv$sqlarea WHERE sql_id = '&&sql_id.')
  LOOP
    DBMS_OUTPUT.PUT_LINE(i.address||','||i.hash_value);
    BEGIN
      SYS.DBMS_SHARED_POOL.PURGE (
        name => i.address||','||i.hash_value,
        flag => 'C'
      );
    EXCEPTION
      WHEN OTHERS THEN
        DBMS_OUTPUT.PUT_LINE(SQLERRM);
    END;
  END LOOP;
END;
/
PRO *** after flush ***
SELECT inst_id, loaded_versions, invalidations, address, hash_value
FROM gv$sqlarea WHERE sql_id = '&&sql_id.' ORDER BY 1;
SELECT inst_id, child_number, plan_hash_value, executions, is_shareable
FROM gv$sql WHERE sql_id = '&&sql_id.' ORDER BY 1, 2;

WHENEVER SQLERROR CONTINUE;
SET DEF ON TERM ON ECHO OFF FEED 6 VER ON HEA ON LIN 80 PAGES 14 LONG 80 LONGC 80 TRIMS OFF TI OFF TIMI OFF SERVEROUT OFF NUMF "" SQLP SQL>;
SET SERVEROUT OFF;
PRO
PRO SQL Patch "sqlpch_&&sql_id." will be used on next parse.
PRO To drop SQL Patch on this SQL:
PRO EXEC DBMS_SQLDIAG.DROP_SQL_PATCH(name => 'sqlpch_&&sql_id.');
PRO
UNDEFINE 1 2 sql_id_1 sql_id hint_text_2 hint_text
CL COL
PRO
PRO sqlpch completed.
SPO OFF;
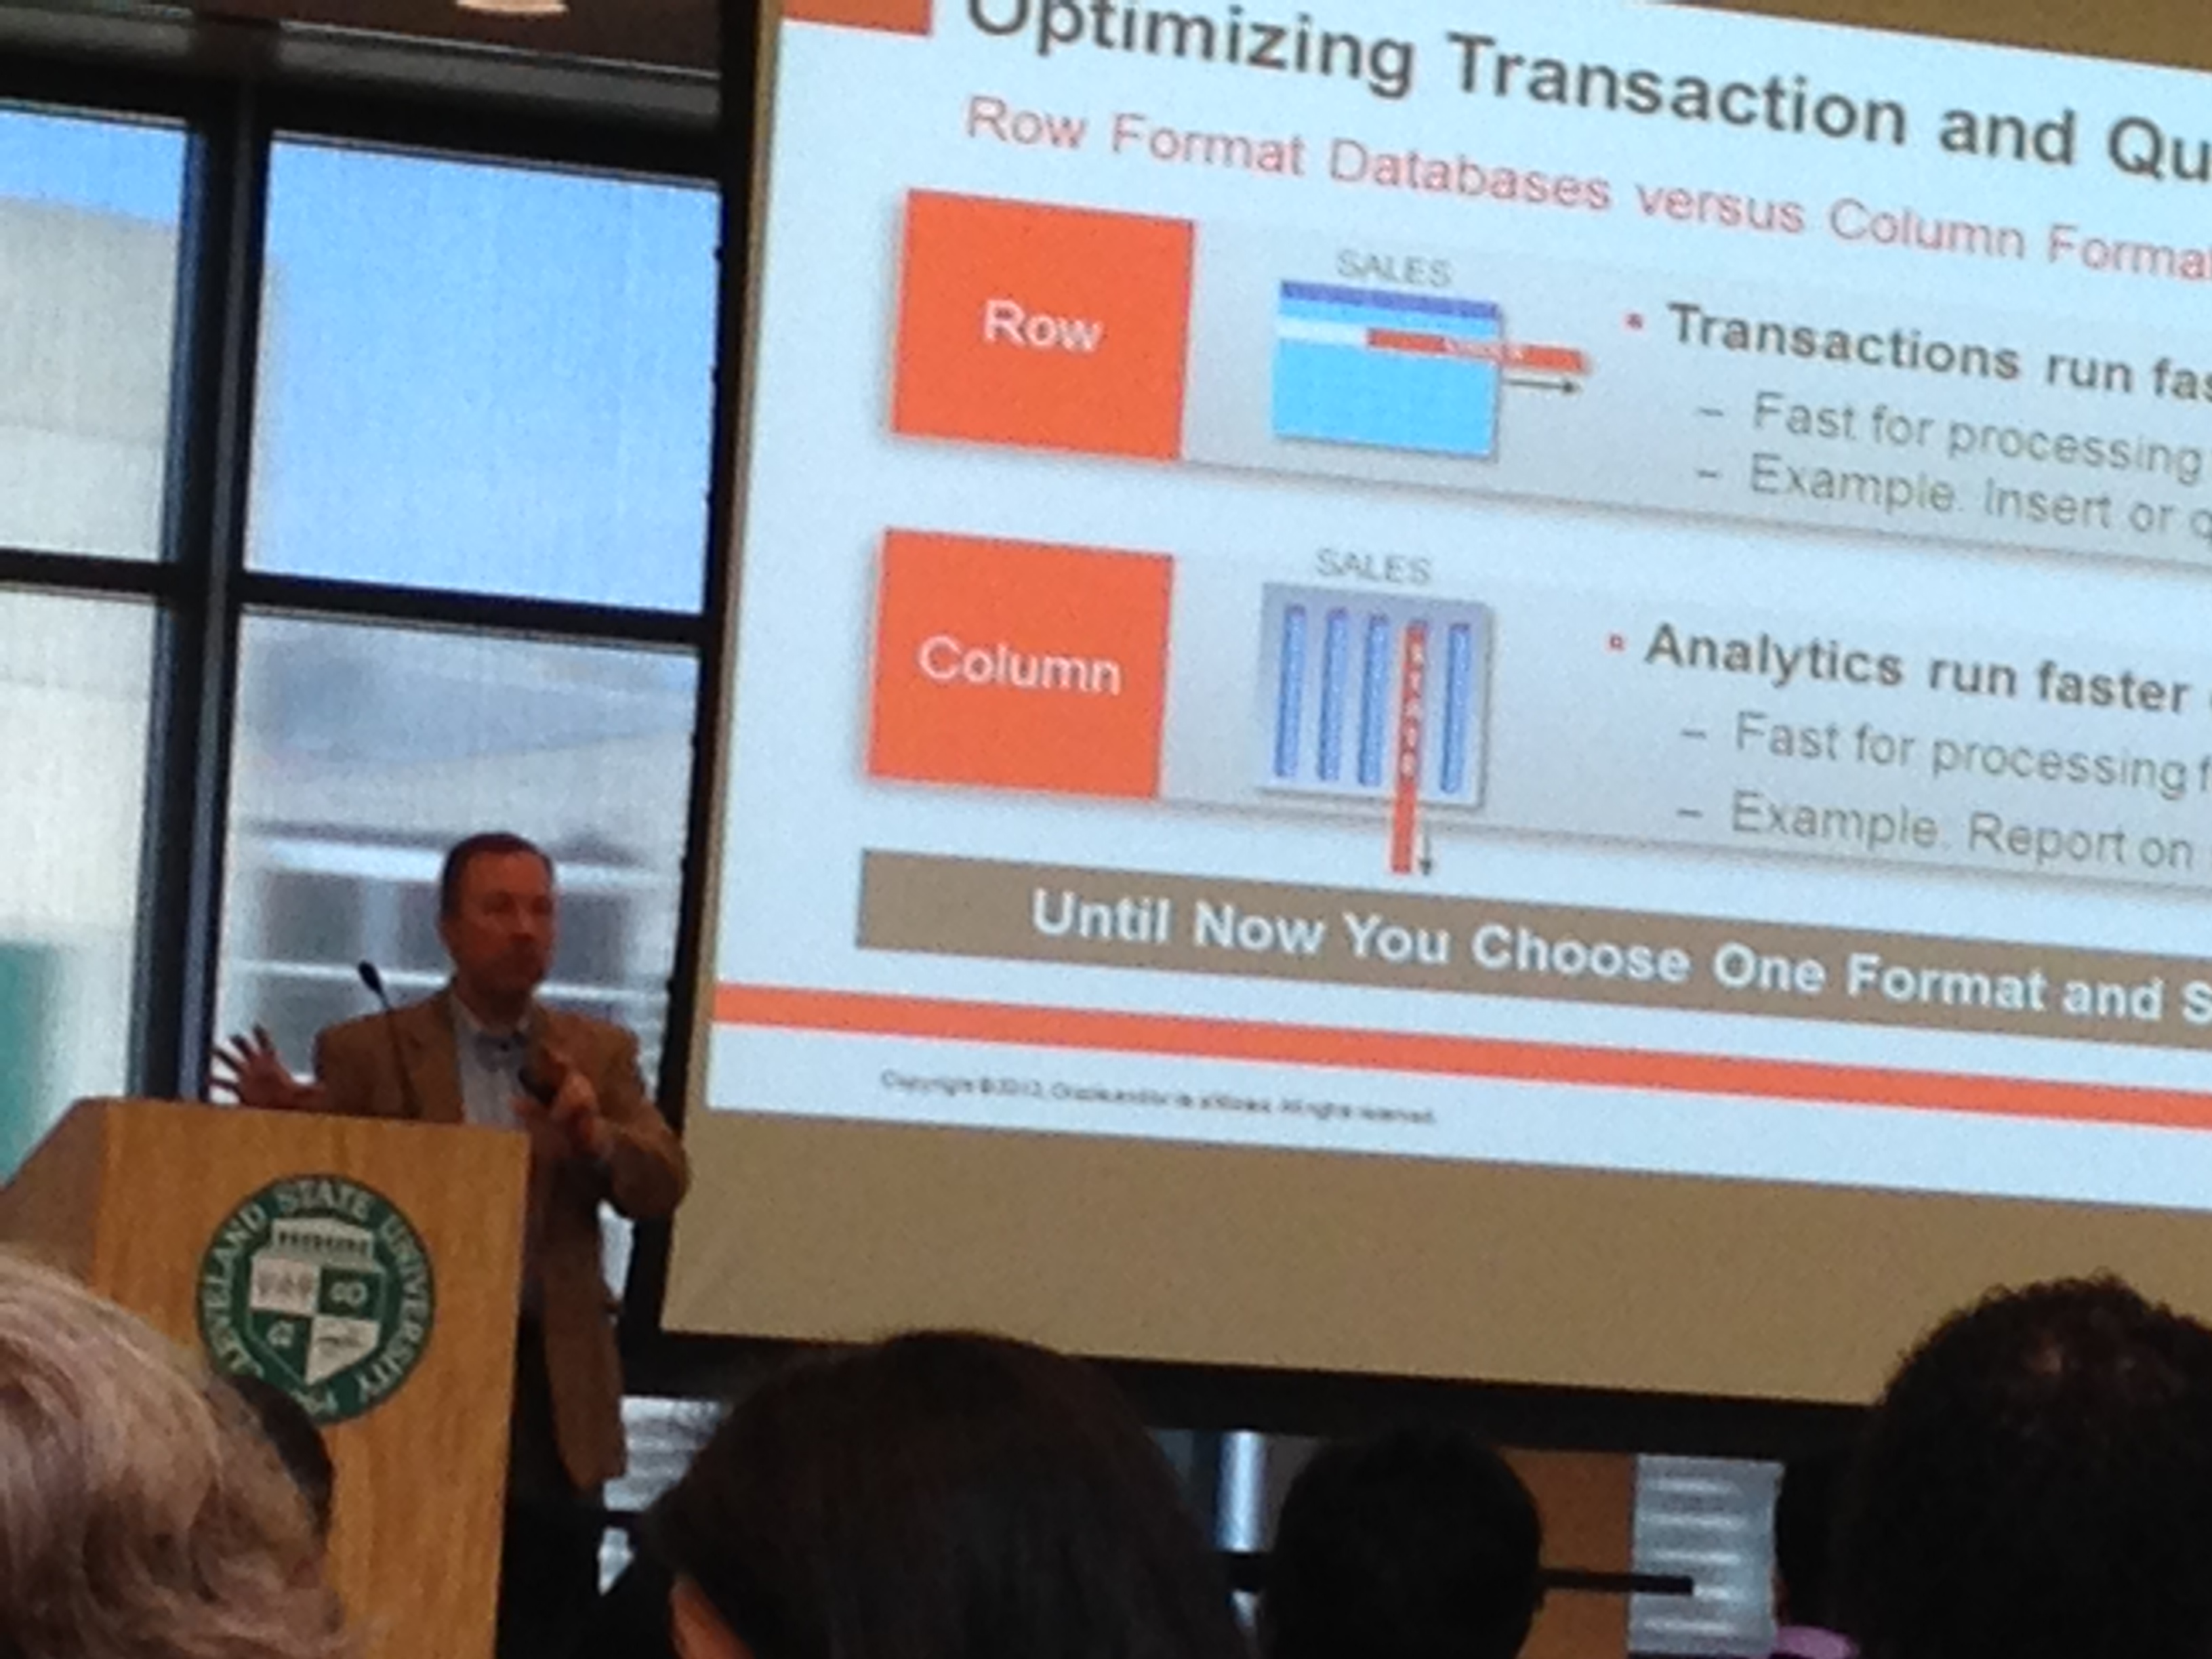
Great Lakes Oracle Conference GLOC May 12-14
Each Oracle Users Group has its own personality. This week I had the honor to co-speak with Mauro Pagano at GLOC, and the experience has been great! We delivered a 4 hours workshop on “Oracle Performance Tuning 101”. We talked about fundamentals and tools of the trade for both Database and SQL Tuning. It was really nice to have over 50 attendees and it was a challenge to keep them engaged for such a long time! Still the feedback was: we want more!
Anyways, as I am listening to Tom Kyte speaking about the new Oracle In-memory Database, I take a moment to write some words about this GLOC. What can I say? In short: It has been awesome! This Oracle Users Group is well organized and growing slowly for surely (over 300 attendees). This is my second year speaking at GLOC and I see it bigger, better and very welcoming. As far as I understand, membership is inexpensive and still manages to attract such good speakers as Tom Kyte, Alex Gorbachev, Scott Spendolini, Tim Gorman, Kyle Hailey, Steven Feuerstein, Carol Dacko, Ric Van Dyke and many others. My kudos to GLOC. Way to go! Looking forward to contribute again next year, and hoping to see more speakers and attendees traveling from other Regions.
Why using SQLTXPLAIN
Every so often I see on a distribution list a posting that starts like this: “I upgraded my application from database release X to release Y and now many queries are performing poorly, can you tell why?”
As everyone else on a distribution list, my first impulse is to make an educated guess permeated by a prior set of experiences. The intentions are always good, but the process is painful and time consuming. Many of us have seen this kind of question, and many of us have good hunches. Still I think our eagerness to help blinds us a bit. The right thing to do is to step back and analyze the facts, and I mean all the diagnostics supporting the observation.
What is needed to diagnose a SQL Tuning issue?
The list is large, but I will enumerate some of the most important pieces:
- SQL Text
- Version of the database (before and after upgrade)
- Database parameters (before and after)
- State of the CBO Statistics (before and after)
- Changes on Histograms
- Basics about the architecture (CPUs, memory, etc.)
- Values of binds if SQL has them
- Indexes compare, including state (visible?, usable?)
- Execution Plan (before and after)
- Plan stability? (Stored Outlines, Profiles, SQL Plan Management)
- Performance history as per evidence on AWR or StatsPack
- Trace from Event 10053 to understand the CBO
- Trace from Event 10046 level 8 or 12 to review Waits
- Active Session History (ASH) if 10046 is not available
I could keep adding bullets to the list, but I think you get the point: There are simply too many things to check! And each takes some time to collect. More important, the state of the system changes overtime, so you may need to re-collect the same diagnostics more than once.
SQLTXPLAIN to the rescue
SQLT or SQLTXPLAIN, has been available on MetaLink (now MOS) under note 215187.1 for over a decade. In short, SQLT collects all the diagnostics listed above and a lot more. That is WHY Oracle Support uses it every day. It simply saves a lot of time! So, I always encourage fellow Oracle users to make use of the FREE tool and expedite their own SQL Tuning analysis. When time permits, I do volunteer to help on an analysis. So, if you get to read this, and you want to help yourself while using SQLT but feel intimidated by this little monster, please give it a try and contact me for assistance. If I can help, I will, if I cannot, I will let you know.
Conclusion
It is fun to guess WHY a SQL is not performing as expected, and trying different guesses is educational but very time consuming. If you want to actually find root causes before trying to fix your SQL, you may want to collect relevant diagnostics. SQLT is there to help, and if installing this tool is not something you can do in a short term, consider then SQL Health-Check SQLHC.
About AWR, SQLT and DB360
This blog posting is about answering this first question below, which I often get asked:
Can I use SQLTXPLAIN (SQLT) instead of AWR?
The answer is: it depends. If you are doing SQL Tuning and you already know the SQL_ID, then you may want to use SQLT XTRACT (MOS 215187.1) directly on the SQL_ID of concern. But even in that case, keep in mind that SQLT accesses AWR data, so your environment must have a valid license to use the Oracle Diagnostics Pack. In fact, when you install SQLT, it asks if you have the Oracle Tuning Pack, the Oracle Diagnostics Pack or none. Depending how you respond, SQLT access or not the set of views and APIs included on those Oracle Packs. That means you can configure SQLT to access or not AWR data.
What is the difference between AWR and SQLT?
In short, the difference between these two is the scope. You use AWR to diagnose database performance, while you use SQLT to diagnose one SQL. Sometimes I explain this difference by saying: “AWR is to an entire database to what SQLT is to one SQL”. One is for system-wide performance, the other is very centric to one SQL at a time.
Why SQLT exists?
I envisioned SQLT on the late 90’s when I was a road-warrior fighting fires in the area of performance, and in particular SQL performance. I found back then that Oracle-provided tools like TKPROF were excellent, but I always needed something more, like knowing the state of the CBO Statistics, Tables and Indexes, etc.
These days, my good friend Mauro Pagano from Oracle, is keeping the ball rolling. He is keeping SQLT in constant motion, making it a better tool on every new version. So, I would say this: SQLT is filling up some gaps that me, and many others, consider important in order to be diligent on root cause analysis for cases were a SQL performs poorly.
What is DB360?
As SQLT brings to the table several pieces of information that we need for SQL Tuning, and which are not available using out-of-the-box tools like TKPROF or SQL Monitoring, the new DB360 tool is doing something similar for the entire database: It complements what AWR provides by producing a report with meaningful information about an entire database. This DB360 is a tool that installs nothing on the database, and produces an HTML report with sections such as Configuration, Sizing, CBO Statistics, Performance Trends, etc.
Is DB360 a licensed product?
No. This DB360 tool belongs to Enkitec. It is not yet available to the Oracle community, but it will be soon. Same as SQLT, if you have an Oracle Tuning or Diagnostics Pack, then when you execute DB360 you would get to see in your DB360 report some pieces of information generated out of views and APIs covered by those Oracle Packs, else you get only the pieces which require no Oracle Pack license. Besides the restriction to limit your use of DB360 as per your Oracle Pack license, DB360 itself will be available to the Oracle community for free, and with no strings attached, same as SQLT.
Why are SQLT and DB360 free to download and use?
These tools are simply a contribution to the Oracle community. “Sharing tools is like sharing knowledge: it makes our IT experience more pleasurable”. The only payback comes when you share back with the Oracle community some of your knowledge, or some of your tools and scripts. If you have been a speaker in an Oracle Users Groups, then you may relate to this gratifying experience to share with others what you know. At RMOUG these past 3 days, I have had the opportunity to experience once again this special sense of community, that is always eager to share and to learn from each other.
Conclusion
SQLT complements TKPROF and SQL Monitor. DB360 complements AWR. When it comes to diagnostics, either for one SQL or for an entire Database, having to our disposal additional diagnostics in the context of our analysis, improves our chances to do a diligent job, while reducing the time that it would take to assembly those pieces manually; all with the extra benefit of having these extra diagnostics pieces consistent to a point in time. So, I hope you continue enjoying SQLT and in the near future DB360!
SQL using Literals instead of Binds. Are all Literals evil?
Every so often I see systems where there is a good amount of SQL that uses Literals instead of Binds, and executes enough times to create a large number of Cursors. Is this a red flag? As many questions regarding performance, I would say the right answer is: it all depends.
Of course we want to use Binds instead of Literals in order to reduce the frequency of Hard Parses, and in turn reduce CPU consumption and space utilization in the Shared Pool. Does it mean we want to replace all Literals with Binds? Do we declare war on Literals? In my opinion, the answer is simply: NO.
If a SQL has a Predicate on a date column, or a key column, then I would expect the Number of Distinct Values (NDV) for such column to be high, and in some cases as high as the number of rows in the Table (unique values for example). In the other hand, if the Predicate is in one of those columns that denotes a code, like Process Type or Status, and the NDV is small, then I’d rather keep the Literal in place. Specially if the data in such column is skewed and I have (or plan to have) Histograms on it.
What do I propose?
- If the SQL is executed sporadically, then it does not matter (Literals or Binds).
- If the SQL executes frequently, and the Predicate in question is on a Column where the Number of Distinct Values (NDV) is high, then use a Bind instead of a Literal (for this Predicate).
- If the SQL executes frequently, and the Predicate in question is on a Column where the NDV is low, then use a Literal (for this Predicate). This assumes the NDV for these Literals is also small.
- Regardless if using a Literal or a Bind for a particular Predicate: If the data in a Column referenced by a Predicate is heavily skewed, gather Statistics with Histograms on this Column.
Follow-up question: When the NDV is high or low? The answer is also: it all depends. I personally prefer to see Literals if the NDV for this Column (and this Literal) is less than 10 (or so).
Why having Binds and Literals on same SQL is better than having all Binds?
If we have good set of CBO Statistics, and we have Histograms on skewed data, and we are using bind peeking, and we are on 11g, and Adaptive Cursor Sharing (ACS) is enabled, and we plan using SQL Plan Management (SPM), then we are for a treat:
With all the “ands” above, by using Binds on predicates with high NDV and Literals in those with low NDV, then we will end up having a small number of different SQL_IDs for what we consider “the same SQL”. Each incarnation of this SQL could potentially have its own set of optimal Execution Plans created by ACS and the CBO (by making use of Histograms on the data and Selectivity Profiles on ACS). Then, with the aid of SPM we could provide stability to those multiple optimal Execution Plans for each version of the SQL. That means that SQL Q1 with Literal L1 could have a different set of optimal plans than Q1 with Literals L2.
Conclusion
Replacing some Literals with Binds but not all Literals sounds like a lot of work, but actually the extra work may be worth the effort. In my opinion, the end result is better if we replace most, but not all (as per proposal above). WHY? Even when ACS does a good job at finding multiple optimal plans for a SQL by using the selectivity of the predicates; by allowing a small number of cursors for the same SQL given the use of Literals in columns with low NDV, we are basically reducing the times we would have to execute a SQL with a sub-optimal plan due to current ACS ramp-up process. This extra granularity provided by a small number of incarnations of the “otherwise same SQL” could be crucial for tuning complex SQL or corner cases.
Exadata Optimizations and SQLTXPLAIN Courses
I will be delivering a couple of courses soon. One in January and the second in February. I will keep posting upcoming Training and Conferences on a new link at the right margin of this blog.
Exadata Optimizations Jan 13-14
This 2-days “Exadata Optimizations” course is for Developers and DBAs new to Exadata and in need to ramp-up quickly. As the name implies, its focus is on Exadata Optimizations. We talk about Smart Scans, Storage Indexes, Smart Flash Cache, Hybrid Columnar Compression (HCC) and Parallel Execution (PX). This course is hands-on, with a fair amount of demos and labs.
SQLTXPLAIN (SQLT) Feb 20-21
This “SQL Tuning with SQLTXPLAIN” 2-days course shows how to use SQLT to actually do SQL Tuning. We go over the ying-yang of the CBO, meaning: Plan Flexibility versus Plan Stability. We use SQLT for labs and we also go over some real-life SQL Tuning cases. If you are currently using SQLT, you are welcome to bring a SQLT Report to class and we could review it there.
Conclusion
New year, new resolutions. I will be investing part of my time sharing knowledge through formal courses and conferences. These days it is hard to find the time and budget to keep our knowledge on the edge, but again and again I see that many of our daily struggles could be mitigated by some concise technical training. So I encourage you to add some training to your list of resolutions for this new year; or at the very least, to get and read some fresh books.
Happy New Year 2014!
Non-intrusive SQL Trace instrumentation on legacy PL/SQL code
Problem
Legacy PL/SQL code with intermittent performance degradation.
To improve the performance of this code, the first step is to diagnose it. But this code has no instrumentation whatsoever, it is in Production, and rolling any code into Production usually requires rigorous testing. So, whatever method we implement has to be light-weight and as safe as possible.
Using Oradebug is not a viable solution mainly for two reasons: It misses the “head” of the transaction, so we may not get to know the SQL taking longer; and second, internal procedures from finding about the issue, reporting it, then acting on it may take from several minutes to hours.
Solution
- Identify which PL/SQL libraries are known to be problematic in terms of intermittent performance degradation.
- At the beginning of each callable PL/SQL Procedure or Function, add a call to DBMS_APPLICATION_INFO.SET_MODULE to set some appropriate MODULE and ACTION, for example “R252, LOAD”. Call this API also at the end, to NULL out these two parameters. This code change is very small and safe. It introduces practically no overhead. It simply labels every SQL executed by the PL/SQL library with some MODULE and ACTION that uniquely identify the code of concern.
- Activate SQL Trace on the module/action that needs to be traced, by calling DBMS_MONITOR.SERV_MOD_ACT_TRACE_ENABLE, passing parameters SERVICE, MODULE and ACTION. With this API request a SQL Trace to be generated with WAITs and BINDs (binds are optional but desirable). Once these traces are no longer needed (reviewed by someone), turn SQL Trace off using API DBMS_MONITOR.SERV_MOD_ACT_TRACE_DISABLE.
- Once the SQL Trace is produced, generate a TKPROF on it. You may want to include parameter “sort=exeela fchela”. This way you get the slower SQL at the top of the TKPROF report.
- With SQL Trace and TKPROF, identify the slower SQL and use SQL Monitor and/or SQL XTRACT to get more granular diagnostics (you need to identify SQL_ID). On any given PL/SQL library, it is common that 1~5 SQL statements consume > 80% of the Elapsed Time. Focus on these large consumers.
Conclusion
Producing a SQL Trace with EVENT 10046 level 8 or 12 is very useful to properly diagnose the code on a PL/SQL library which performs poorly. A follow-up on the slower SQL with SQL Monitor and/or SQLT XTRACT is in order. The method presented above is very easy and safe to implement.
Counting rows fast
A friend of mine asked me last night basically this: “How is that SQLTXPLAIN counts rows?”. In particular, he was referring to the use of the SAMPLE clause of the SELECT statement. Look at this SQLT’s log piece:
SQL_ID a9x1kc4ymyhkz
--------------------
SELECT /*+ FULL(t) PARALLEL */ COUNT(*) * 1e4
FROM "XYPZ"."INSTRUMENT" SAMPLE (.01) t

SQL_ID 025v6k1032t69
--------------------
SELECT /*+ FULL(t) PARALLEL */ COUNT(*) * 1e5
FROM "XYPZ"."POSITION_COMPOSITION" SAMPLE (.001) t

SQL_ID 8rby3340xpd9k
--------------------
SELECT /*+ FULL(t) PARALLEL */ COUNT(*) * 1e5
FROM "XYPZ"."POSITION_EVENT" SAMPLE (.001) t
WHY is it that SQLT has to count rows?
SQLT has to count rows so it can report side by side DBA_TABLES.NUM_ROWS and COUNT(*) from each Table. This is an easy way to see if your statistics are way off, and this mechanism exists on SQLT well before DBA_TAB_MODIFICATIONS came to existence. Actually, SQLT uses both methods to health-check how stale are your Table statistics.
The conundrum here is: “I use SQLT because I want to diagnose a performance issue on a QUERY on top of large Tables, but I do not want SQLT to take a long time just to produce a COUNT(*) of my Tables…”.
Fast versus Precise
In Performance tuning, there is always a trade-off. You want X but you sacrifice B. Counting rows is no different. Do you want it faster? Then you sacrifice precision. The SAMPLE clause of the SELECT statement allows you to do exactly that (syntax below):
SAMPLE [ BLOCK ] ( sample_percent ) [ SEED ( seed_value ) ]
So, if you specify a 10% sample size then you have to multiply the COUNT(*) by 10. If you sample 1% you multiply the COUNT(*) by 100. In large Tables if you sample, lets say 0.1%, your multiplier becomes 1,000, which is the same than 1e3 (10**3 or 10^3 depending where you went to school). Sample size can be as small as 0.000,001 and as large as 100 (but without including 100 itself). It represents probabilities more than an actual sample size.
The optional BLOCK clause simple says: use sample blocks instead of rows. And the optional SEED clause tries to provide some consistency in the result of the count when you use the same value for two executions of the exact same count. This SEED clause takes a value between 0 and 4,294,967,295.
How SQLT counts rows?
SQLT has over 40 tool parameters. One of them is count_star_threshold with a seeded value of 10,000.
SQLT includes a small algorithm (below) that determines the size of the SAMPLE according to the estimated size of the Table itself, by looking at its statistics as per DBA_TABLES.NUM_ROWS. No statistics? then skip the sample and do a normal full scan. If the Table is expected to be smaller then the count_star_threshold, then do a full scan. So is up to 10x this threshold. After that, use a sample size proportionally inverse to the Table size. The bigger the Table the smaller the Sample.
SQLT also forces a full Table scan and invokes Parallel Execution (PX) as a method to expedite the count. This count can be really fast on Exadata systems as you can imagine.
 /* -------------------------
 *
 * private perform_count_star
 *
 * called by: sqlt$i.common_calls and sqlt$i.remote_xtract
 *
 * ------------------------- */
 PROCEDURE perform_count_star (p_statement_id IN NUMBER)
 IS
 l_sql VARCHAR2(32767);
 l_number NUMBER;
 l_count NUMBER;
 BEGIN
 write_log('=> perform_count_star');

IF sqlt$a.get_param_n('count_star_threshold') = 0 THEN
 write_log('skip "count_star" as per corresponding parameter');
 ELSE
 FOR i IN (SELECT owner, table_name, num_rows, source
 FROM &&tool_administer_schema..sqlt$_dba_all_tables_v
 WHERE statement_id = p_statement_id
 ORDER BY
 owner, table_name)
 LOOP
 IF i.num_rows IS NULL THEN
 l_sql := 'SELECT /*+ FULL(t) PARALLEL */ COUNT(*)
FROM "'||i.owner||'"."'||i.table_name||'" t WHERE ROWNUM <= :number';
 l_number := sqlt$a.get_param_n('count_star_threshold');
 ELSIF i.num_rows < sqlt$a.get_param_n('count_star_threshold') THEN
 l_sql := 'SELECT /*+ FULL(t) PARALLEL */ COUNT(*)
FROM "'||i.owner||'"."'||i.table_name||'" t WHERE ROWNUM <= :number';
 l_number := sqlt$a.get_param_n('count_star_threshold') * 10;
 ELSIF i.num_rows < (sqlt$a.get_param_n('count_star_threshold') * 1e1) THEN
 l_sql := 'SELECT /*+ FULL(t) PARALLEL */ COUNT(*) * 1e1
FROM "'||i.owner||'"."'||i.table_name||'" SAMPLE (:number) t';
 l_number := 1e1;
 ELSIF i.num_rows < (sqlt$a.get_param_n('count_star_threshold') * 1e2) THEN
 l_sql := 'SELECT /*+ FULL(t) PARALLEL */ COUNT(*) * 1e2
FROM "'||i.owner||'"."'||i.table_name||'" SAMPLE (:number) t';
 l_number := 1e0;
 ELSIF i.num_rows < (sqlt$a.get_param_n('count_star_threshold') * 1e3) THEN
 l_sql := 'SELECT /*+ FULL(t) PARALLEL */ COUNT(*) * 1e3
FROM "'||i.owner||'"."'||i.table_name||'" SAMPLE (:number) t';
 l_number := 1/1e1;
 ELSIF i.num_rows < (sqlt$a.get_param_n('count_star_threshold') * 1e4) THEN
 l_sql := 'SELECT /*+ FULL(t) PARALLEL */ COUNT(*) * 1e4
FROM "'||i.owner||'"."'||i.table_name||'" SAMPLE (:number) t';
 l_number := 1/1e2;
 ELSIF i.num_rows < (sqlt$a.get_param_n('count_star_threshold') * 1e5) THEN
 l_sql := 'SELECT /*+ FULL(t) PARALLEL */ COUNT(*) * 1e5
FROM "'||i.owner||'"."'||i.table_name||'" SAMPLE (:number) t';
 l_number := 1/1e3;
 ELSIF i.num_rows < (sqlt$a.get_param_n('count_star_threshold') * 1e6) THEN
 l_sql := 'SELECT /*+ FULL(t) PARALLEL */ COUNT(*) * 1e6
FROM "'||i.owner||'"."'||i.table_name||'" SAMPLE (:number) t';
 l_number := 1/1e4;
 ELSIF i.num_rows < (sqlt$a.get_param_n('count_star_threshold') * 1e7) THEN
 l_sql := 'SELECT /*+ FULL(t) PARALLEL */ COUNT(*) * 1e7
FROM "'||i.owner||'"."'||i.table_name||'" SAMPLE (:number) t';
 l_number := 1/1e5;
 ELSE
 l_sql := 'SELECT /*+ FULL(t) PARALLEL */ COUNT(*) * 1e8
FROM "'||i.owner||'"."'||i.table_name||'" SAMPLE (:number) t';
 l_number := 1/1e6;
 END IF;

l_sql := REPLACE(l_sql, ':number', l_number);
 write_log('num_rows='||i.num_rows||' sql='||l_sql);
 l_count := NULL;

BEGIN
 EXECUTE IMMEDIATE l_sql INTO l_count;
 write_log(l_count||' rows counted');
 EXCEPTION
 WHEN OTHERS THEN
 write_log('** '||SQLERRM);
 write_log(l_sql||' failed with error above. Process continues.');
 END;

IF l_count IS NOT NULL THEN
 IF i.source = 'DBA_TABLES' THEN
 UPDATE &&tool_repository_schema..sqlt$_dba_tables
 SET count_star = l_count
 WHERE statement_id = p_statement_id
 AND owner = i.owner
 AND table_name = i.table_name;
 ELSIF i.source = 'DBA_OBJECT_TABLES' THEN
 UPDATE &&tool_repository_schema..sqlt$_dba_object_tables
 SET count_star = l_count
 WHERE statement_id = p_statement_id
 AND owner = i.owner
 AND table_name = i.table_name;
 END IF;
 END IF;
 END LOOP;

COMMIT;
 END IF;

write_log('<= perform_count_star');
 END perform_count_star;
Conclusion
Counting rows is like counting beans, you can count one at a time, or you can take some shortcuts. If you are willing to sacrifice some precision for the sake of gaining performance, consider then using the SAMPLE clause of the SELECT statement.
Carlos Sierra’s shared Scripts and Presentations
I recently delivered 3 sessions at the East Coast Oracle Users Group (ECO). During these sessions I offered to share the actual Presentations and some of the Scripts I used during the 3rd session. I plan to keep updating and expanding both scripts and presentations. They also show now on the right side of this page. Feel free to use, share and recycle any of my scripts and presentations.
A healthy way to do an Oracle database health-check
Q: How do I do an Oracle database health-check?
A: It all depends. (hint: we can use this answer for most Oracle related questions in general and Performance related in particular, but don’t try it at home).
This seems like a quite broad question and yes it is. And of course there are many ways to proceed with a database health-check. So at this post I ‘d rather talk about: what I think is a healthy way to approach an Oracle database health-check.
- Start with the basics: Listen to the users of this database. If nobody complains then most probably you would have to define the scope by yourself. In any case, go on.
- Gather environment information. This includes the understanding of the architecture used, the databases on such architecture and the applications on those databases. Also learn who is who: Users, DBAs and Developers.
- Gather metrics. I am referring to OS metrics (CPU, IO and Memory), and also database metrics (AWR) together with alert logs. When gathering these metrics focus on time periods where the pain has been reported, and slice the time as small as possible (i.e. AWR reports for each time slice captured, avoiding the 6-24 hours time frame common mistake).
- Let the combination of complains (concerns) and findings on metrics to guide you to the next step. This is where most get lost. So don’t panic and dive in into what you see as contention on your metrics. Keep in mind that the most important metric of all is “user response time”, so anything affecting it must be in your priority list.
- There are many more things to check, but they are more in the configuration and sound practices arena. For example: redundancy on control files, archive mode, backups, non-default parameters, PX setup, memory setup, etc. For these, creating a check list would help.
- At some point you will have many leads and you will start to lose focus. Do some yoga or go for a walk, then make an A, B, C list with what is really important, what is kind-of and what is mere style.
- You are not an expert on every aspect of the database (nobody is). So, do not pretend you can do everything yourself. Rely on your peers and/or contacts. Reach out for help in those areas where you feel insecure (feeling insecure is a good thing, much better than feeling secure without any solid foundation).
- Once you think you have it nailed, go to your peers, colleagues, boss(es), friends, partner, or strangers if necessarily, and solicit a review of your findings and recommendations. Accept feedback. This is key. Maybe what you thought was sound it makes absolutely no sense to someone with more experience or simply with a different view.
- Reconsider everything. Avoid the pitfall of assuming that what you have learn in your two-digits years of experience can be applied to every case. For example, if you have done mostly SQL Tuning, don’t expect every issue to be SQL Tuning. Health-checks are like fortune cookies, you never know what you will get.
- Last but not least: Learn from your new experience, practice listening to others, use your common sense, exercise your knowledge, and work as a team member. Add the word “collaboration” to your daily work and maybe one day you will learn you are not alone.
Cheers — Carlos
