Function to compute SQL_ID out of SQL_TEXT
Ric Van Dyke from Hotsos asked me yesterday if I knew of a PL/SQL function that inputs a SQL_TEXT and outputs a SQL_ID. I kind of remembered Tanel Poder had written something on this regard. And I also recalled seen an API under DBMS_UTILITY that would provide the SQL_ID given a SQL_TEXT. When I researched on both, I was able to get from Tanel a function to generate the SQL HASH_VALUE out of given SQL_ID, and from DBMS_UTILITY another API to get the SQL HASH_VALUE out of a SQL_TEXT provided as a VARCHAR2. But I could not find one to compute SQL_ID given SQL_TEXT written on PL/SQL. But Slavik Markovich gave me the insight that I needed to build a PL/SQL function that computes SQL_ID out of SQL Text. Slavik’s function is written on Python.
So, thanks to Ric for his challenging question/request, and to Tanel and Slavik for their valuable insight, I was encouraged to develop this function. Feel free to use it! I have seen the same question been asked a few times in the past, so at least I know we have such a function now!
GRANT EXECUTE ON SYS.DBMS_CRYPTO TO csierra;
CREATE OR REPLACE FUNCTION compute_sql_id (sql_text IN CLOB)
RETURN VARCHAR2 IS
 BASE_32 CONSTANT VARCHAR2(32) := '0123456789abcdfghjkmnpqrstuvwxyz';
 l_raw_128 RAW(128);
 l_hex_32 VARCHAR2(32);
 l_low_16 VARCHAR(16);
 l_q3 VARCHAR2(8);
 l_q4 VARCHAR2(8);
 l_low_16_m VARCHAR(16);
 l_number NUMBER;
 l_idx INTEGER;
 l_sql_id VARCHAR2(13);
BEGIN
 l_raw_128 := /* use md5 algorithm on sql_text and produce 128 bit hash */
 SYS.DBMS_CRYPTO.hash(TRIM(CHR(0) FROM sql_text)||CHR(0), SYS.DBMS_CRYPTO.hash_md5);
 l_hex_32 := RAWTOHEX(l_raw_128); /* 32 hex characters */
 l_low_16 := SUBSTR(l_hex_32, 17, 16); /* we only need lower 16 */
 l_q3 := SUBSTR(l_low_16, 1, 8); /* 3rd quarter (8 hex characters) */
 l_q4 := SUBSTR(l_low_16, 9, 8); /* 4th quarter (8 hex characters) */
 /* need to reverse order of each of the 4 pairs of hex characters */
 l_q3 := SUBSTR(l_q3, 7, 2)||SUBSTR(l_q3, 5, 2)||SUBSTR(l_q3, 3, 2)||SUBSTR(l_q3, 1, 2);
 l_q4 := SUBSTR(l_q4, 7, 2)||SUBSTR(l_q4, 5, 2)||SUBSTR(l_q4, 3, 2)||SUBSTR(l_q4, 1, 2);
 /* assembly back lower 16 after reversing order on each quarter */
 l_low_16_m := l_q3||l_q4;
 /* convert to number */
 SELECT TO_NUMBER(l_low_16_m, 'xxxxxxxxxxxxxxxx') INTO l_number FROM DUAL;
 /* 13 pieces base-32 (5 bits each) make 65 bits. we do have 64 bits */
 FOR i IN 1 .. 13
 LOOP
 l_idx := TRUNC(l_number / POWER(32, (13 - i))); /* index on BASE_32 */
 l_sql_id := l_sql_id||SUBSTR(BASE_32, (l_idx + 1), 1); /* stitch 13 characters */
 l_number := l_number - (l_idx * POWER(32, (13 - i))); /* for next piece */
 END LOOP;
 RETURN l_sql_id;
END compute_sql_id;
/
SHOW ERRORS;
-- test
SET SERVEROUT ON;
SELECT compute_sql_id('select ''Slavik'' from dual') FROM DUAL;
-- you should get 29schpgjyfxux
SQL Tuning with SQLTXPLAIN 2-days Workshop
SQLTXPLAIN is a SQL Tuning tool widely used by the Oracle community. Available through My Oracle Support (MOS) under document 215187.1, this free tool is available for download and use to anyone with MOS access. It has helped thousands of times to expedite the resolution of SQL Tuning issues, and many Oracle DBAs and Developers benefit of its use on a daily basis.
Stelios Charalambides has done an excellent job writing a book on this topic. In his book Stelios covers many aspects about SQLTXPLAIN and some related topics. I highly recommend to get a copy of this book if you want to learn more about SQLTXPLAIN. It is available at Amazon and many other retailers.
The new 2-days SQLTXPLAIN Workshop offered by Enkitec (an Oracle Platinum business partner and my employer) is a completely new course that interleaves “how to use effectively SQLTXPLAIN” with important and related SQL Tuning Topics such as Plan Flexibility and Plan Stability. This hands-on workshop offers participants the unique opportunity to fully understand the contents of SQLTXPLAIN and its vast output through an interactive session. About half the time is dedicated to short guided labs, while the other half uses presentations and demos. This workshop is packed with lots of content. It was a real challenge packaging so much info in only two days, but I am very pleased with the result. It became a 2-days intensive knowledge transfer hands-on workshop on SQLTXPLAIN and SQL Tuning!
The first session of this workshop is scheduled for November 7-8 in Dallas, Texas. I expect this pilot session to fill out fast. Other sessions and onsite ones will be offered during 2014. I hope to meet many of you face to face on November 7!
About SQLT Repository
SQLTXPLAIN maintains a repository of metadata associated to a SQL statement being analyzed. A subset of this SQLT repository is automatically exported every time one of the main methods (like XTRACT) is used. A question sometimes I get is: what do you do with this SQLT repository? Well, in most cases: nothing. That is because most of the diagnostics we need are already included in the main report. But in some very particular cases we may want to dig into the SQLT repository. For example, in a recent case I wanted to understand some patterns about a particular wait event that happen to become “slower” after the application of an Exadata patch. Then, when IO Resource Manager IORM was configured from Basic to Auto, these waits became “fast” again. How to measure that? How to observe any trends and correlated to the times when the patch was applied and then when the IORM was adjusted? Fortunately SQLT had been used, and it captured ASH data out of AWR before it aged out. So I was able to use it in order to get to “see” these trends below.
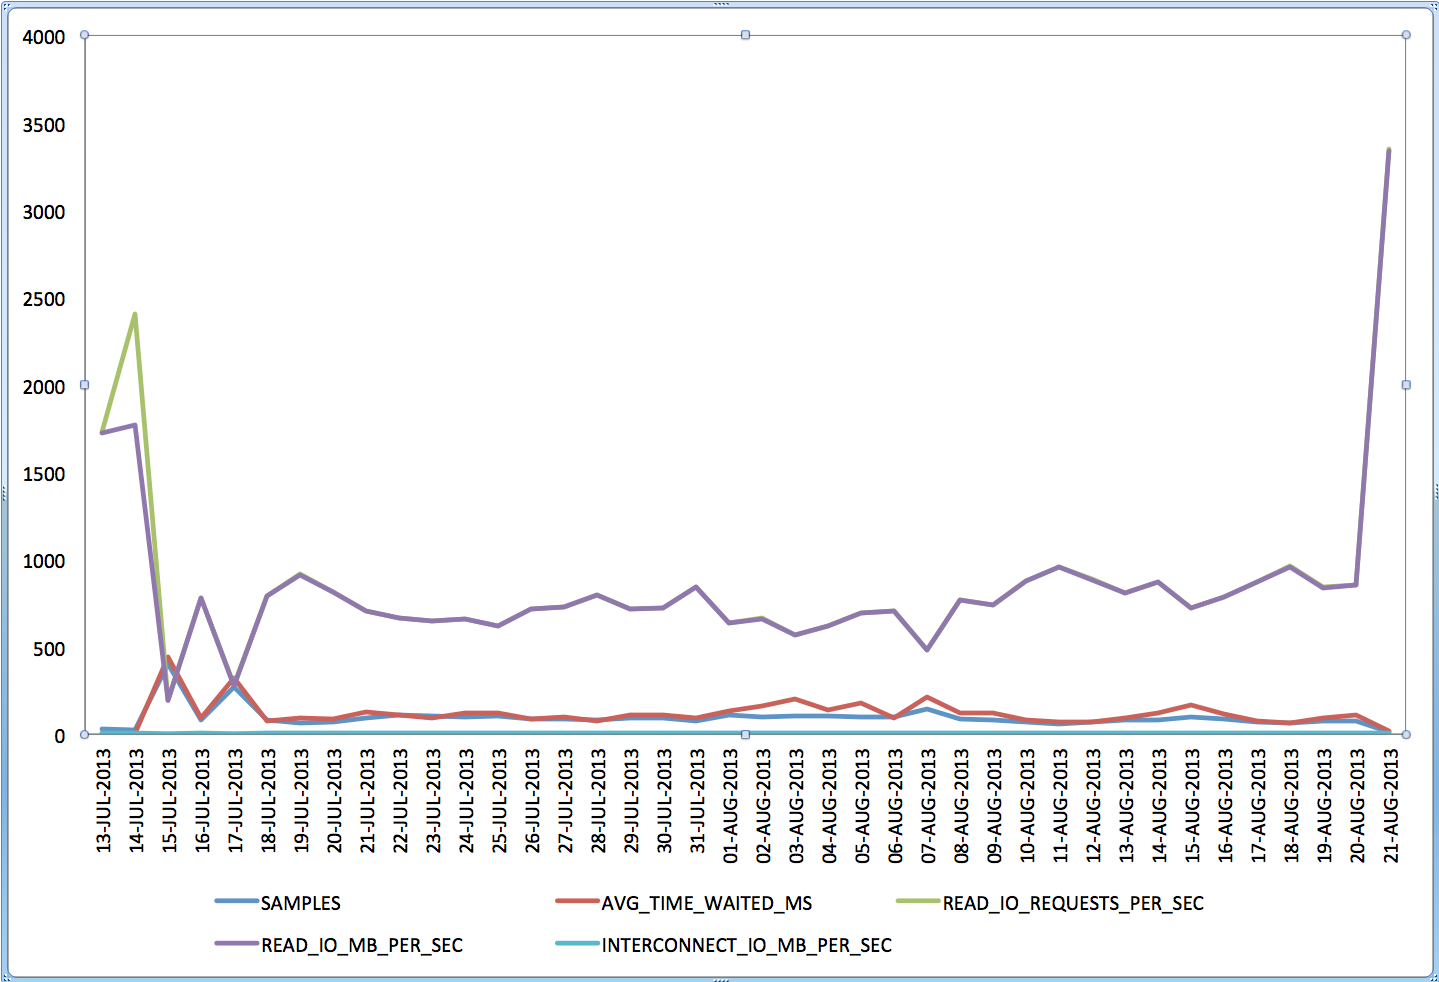
Now the question becomes: How do I produce this kind of graph? Well, with Excel it is easy, we just need to bring the piece of the SQLT repository that we want into Excel. For that, I first import the whole SQLT repository for a given sqlt_sNNNNN_*.zip file into my local SQLT repository. The command is spelled out in the sqlt_sNNNNN_readme.html as “import SQLT repository”, then I just use SQL Developer to export the output of a query into XLS (or CSV). In this case the SQL I used was the one below.
If you try to use the SQLT repository for some similar data analysis and you struggle with it, please let me know and I will help you out.
WITH awr_ash AS (
SELECT DISTINCT -- two or more statements can include same snaps
 sample_time,
 sql_plan_hash_value,
 sql_plan_line_id,
 wait_class,
 event,
 time_waited,
 ROUND(time_waited / 1e3) time_waited_ms,
 current_obj#,
 machine,
 delta_time,
 delta_read_io_requests,
 delta_write_io_requests,
 delta_read_io_bytes,
 delta_write_io_bytes,
 delta_interconnect_io_bytes,
 ROUND(delta_read_io_requests / (delta_time / 1e6)) read_io_requests_per_sec,
 ROUND(delta_write_io_requests / (delta_time / 1e6)) write_io_requests_per_sec,
 ROUND(delta_read_io_bytes / (delta_time / 1e6)) read_io_bytes_per_sec,
 ROUND(delta_write_io_bytes / (delta_time / 1e6)) write_io_bytes_per_sec,
 ROUND(delta_interconnect_io_bytes / (delta_time / 1e6)) interconnect_io_bytes_per_sec
 FROM sqlt$_dba_hist_active_sess_his
 WHERE statement_id IN (90959, 90960, 90962, 90963)
 AND session_state = 'WAITING'
 AND time_waited > 0
 AND delta_time > 0
 AND wait_class IS NOT NULL ),
awr_ash_grp AS (
SELECT TRUNC(sample_time) sample_day,
 event,
 COUNT(*) samples,
 ROUND(AVG(time_waited_ms)) avg_time_waited_ms,
 ROUND(AVG(read_io_requests_per_sec)) read_io_requests_per_sec,
 ROUND(AVG(write_io_requests_per_sec)) write_io_requests_per_sec,
 ROUND(AVG(read_io_bytes_per_sec)) read_io_bytes_per_sec,
 ROUND(AVG(write_io_bytes_per_sec)) write_io_bytes_per_sec,
 ROUND(AVG(interconnect_io_bytes_per_sec)) interconnect_io_bytes_per_sec
 FROM awr_ash
 GROUP BY
 TRUNC(sample_time),
 event ),
cell_smart_reads AS (
SELECT sample_day,
 TO_CHAR(sample_day, 'DD-MON-YYYY') sample_date,
 samples,
 avg_time_waited_ms,
 read_io_requests_per_sec,
 read_io_bytes_per_sec,
 ROUND(read_io_bytes_per_sec / (1024 * 1024)) read_io_mb_per_sec,
 interconnect_io_bytes_per_sec,
 ROUND(interconnect_io_bytes_per_sec / (1024 * 1024), 1) interconnect_io_mb_per_sec
 FROM awr_ash_grp
 WHERE event = 'cell smart table scan' )
SELECT sample_date,
 samples,
 avg_time_waited_ms,
 read_io_requests_per_sec,
 read_io_mb_per_sec,
 interconnect_io_mb_per_sec
 FROM cell_smart_reads
 ORDER BY
 sample_day;
SQLTXPLAIN 12.1.01 is now available
Mauro Pagano is doing a great job keeping SQLT well taken care! Version 12.1.01 is now available for download out of MOS (Metalink) doc_id 215187.1. With a monthly release, it is always a good idea to download the latest version at least every quarter. This latest version includes some adjustments for 12c and some other changes as seen below. Here is the list of changes for the past 3 months. The saga continues!
12.1.01 August 19, 2013
- BUG: Incorrect date wrapping in report “Non-Default or Modified Session Parameters”
- BUG: SQLHC Table Summary reporting section was skipping tables if they had no index defined on them
- BUG: The logic in “Newest Value” column in Modified System Parameters needed to be adjusted, the value was sometime incorrect
- BUG: CBO Environment section was reporting a parameter many times if that param had been changed more than once
- ENH: SQLT and SQLHC works on 12c!
- ENH: Improved SQLHC HC on corrupt histograms for 12c
- ENH: SQLT can now create user SQLTXADMIN in presence of password complexity verification function
- ENH: Stat table creation now supports Unicode charset in both SQLT TC and SQLT TCX
- ENH: Importing SQLT TC now handles IOT remapping
- ENH: Fix for 12c
sqlt$a: *** d:ORA-12899: value too large for column “SQLTXPLAIN”.”SQLT$_DBA_TAB_COLS”.”LOW_VALUE” (actual: 45, maximum: 40). - ENH: Added “version date” to SQLHC to make it easier to recognize if an old version is used
- ENH: Added “user” to SQLHC reporting the db login user
- ENH: SQLDX is now executed after SQLT/SQLHC completes, it helps in case SQLDX takes a long time to run since the zip file for SQLT/SQLHC is ready to be moved even when SQLDX is still running
- ENH: Added NUM_CPUs, NUM_COREs and NUM_CPU_SOCKETs info from V$OSSTAT to SQLT/SQLHC to help with multicore/multisocket CPUs
- ENH: Added Historical SQL Statistics – Total section to SQLHC
- ENH: SQLHC Exec now captures session statistics for the SQL analyzed
- ENH: New HC on Mviews not used in the SQL/plan that are defined on top of tables involved in the SQL/plan
- ENH: New column “If Offloadable” and “IO Saved %” on Exadata in Performance Statistics section
- ENH: New HC on Rewrite Equivalences defined by the owner of the objects involved in the SQL/plan
11.4.5.10 July 15, 2013
- BUG: Fixed issue with XPREXT and XPREXC where ASH was not turned off completely
- ENH: New health-check on plans with same PHV but predicates with different ordering
- ENH: SQLHC and SQLHCXEC now provides information about DBMS_STATS preferences
- ENH: SQLT shows when a parameter value has been changed (when this info is available in AWR)
- ENH: New link to Table Statistics Extensions directly available in the top menu
11.4.5.9 June 10, 2013
- ENH: New health-check on SDREADTIM/MREADTIM in Exadata
- ENH: Added SQLT parameter tcb_sampling_percent to control TCB sampling data percentage
- ENH: If no SQL is identified using the input string as HASH_VALUE then a search on PLAN_HASH_VALUE is performed
- ENH: Introduced new parameter c_ash_hist_days to split AWR data collection from ASH data collection and to limit the amount of info extracted from ASH
- ENH: Added scale information for TIMESTAMP datatype in Captured Binds sections
- ENH: ASH reports are now generated 1 per hour/instance starting from the interval where the SQL was most impacting
- ENH: SQLDX (SQL Dynamic eXtractor) collects only up to 10k rows per table/view
Creating a big Sales table
I need a large Table to do some testing of SQLTXPLAIN in Exadata. Seeded SALES Table out of the SH sample schema is not big enough for the test I want to do. This SH.SALES tables has less than 1M rows and I need a few billion rows. So, I could just fabricate my own data or I could expand the SH.SALES table. I opted for the latter so I could join this big table with some dimension tables out of the same sample schema.
This is the script that I used. It is still running. I expect 31B rows out of it. Sharing here in case you need a big sales table.
CREATE TABLE sales_big AS
WITH
p AS (SELECT prod_id FROM sh.products WHERE ROWNUM <= 50), -- max 50
c AS (SELECT cust_id FROM sh.customers WHERE ROWNUM <= 5000), -- max 50000
t AS (SELECT time_id FROM sh.times WHERE ROWNUM <= 500), -- max 1000
h AS (SELECT channel_id FROM sh.channels WHERE ROWNUM <= 5), -- max 5
r AS (SELECT promo_id FROM sh.promotions WHERE ROWNUM <= 50) -- max 500
-- 50 * 5000 * 500 * 5 * 50 = 31,250,000,000
SELECT p.prod_id,
 c.cust_id,
 t.time_id,
 h.channel_id,
 r.promo_id,
 ROUND(ABS(DBMS_RANDOM.NORMAL) * 100) quantity_sold,
 ROUND(DBMS_RANDOM.VALUE(0, 1000) * ABS(DBMS_RANDOM.NORMAL), 2) amount_sold
 FROM p, c, t, h, r;
E4 Day 2
Second day of E4 as great. Look at the agenda. What can I tell? Great event! I learned a lot and I feel quite motivated to dive into all this Exadata ecosystem. Anyways, I have to pack and move to my 3rd hotel 😉
Some pictures from E4 day 2:

Doug Cutting – Big Data Keynote
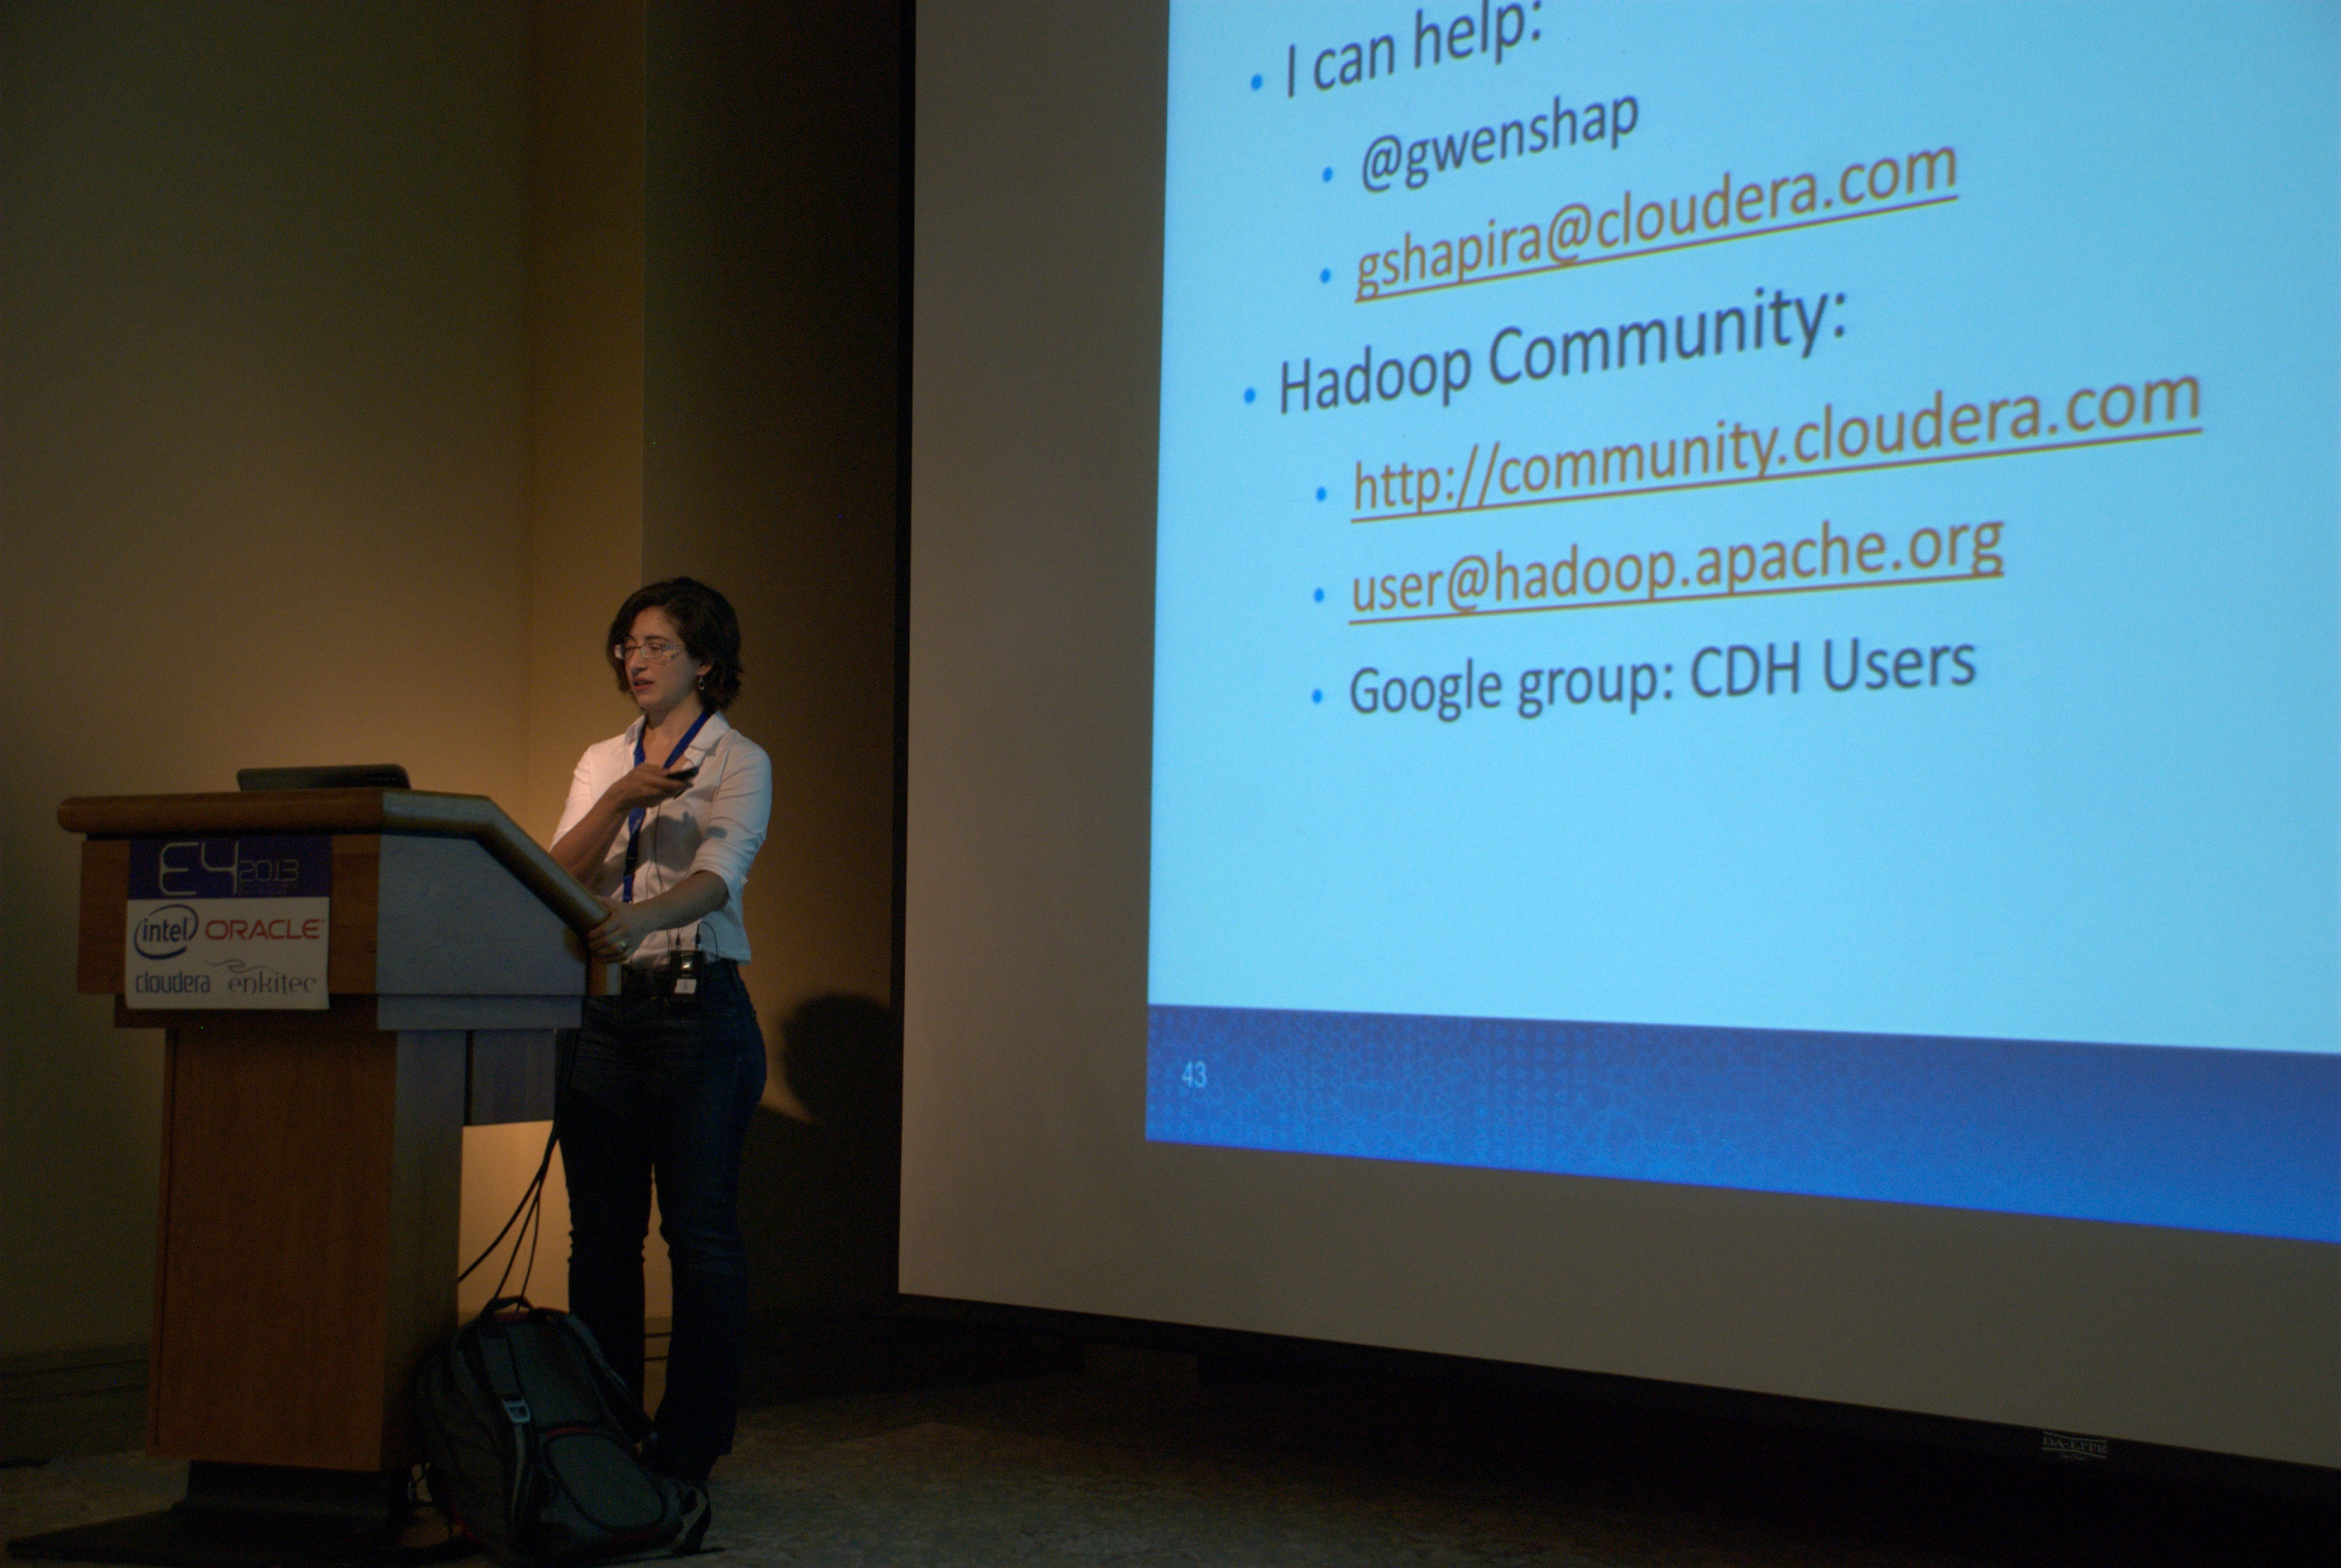
Gwen Shapira – Is Hadoop for You?
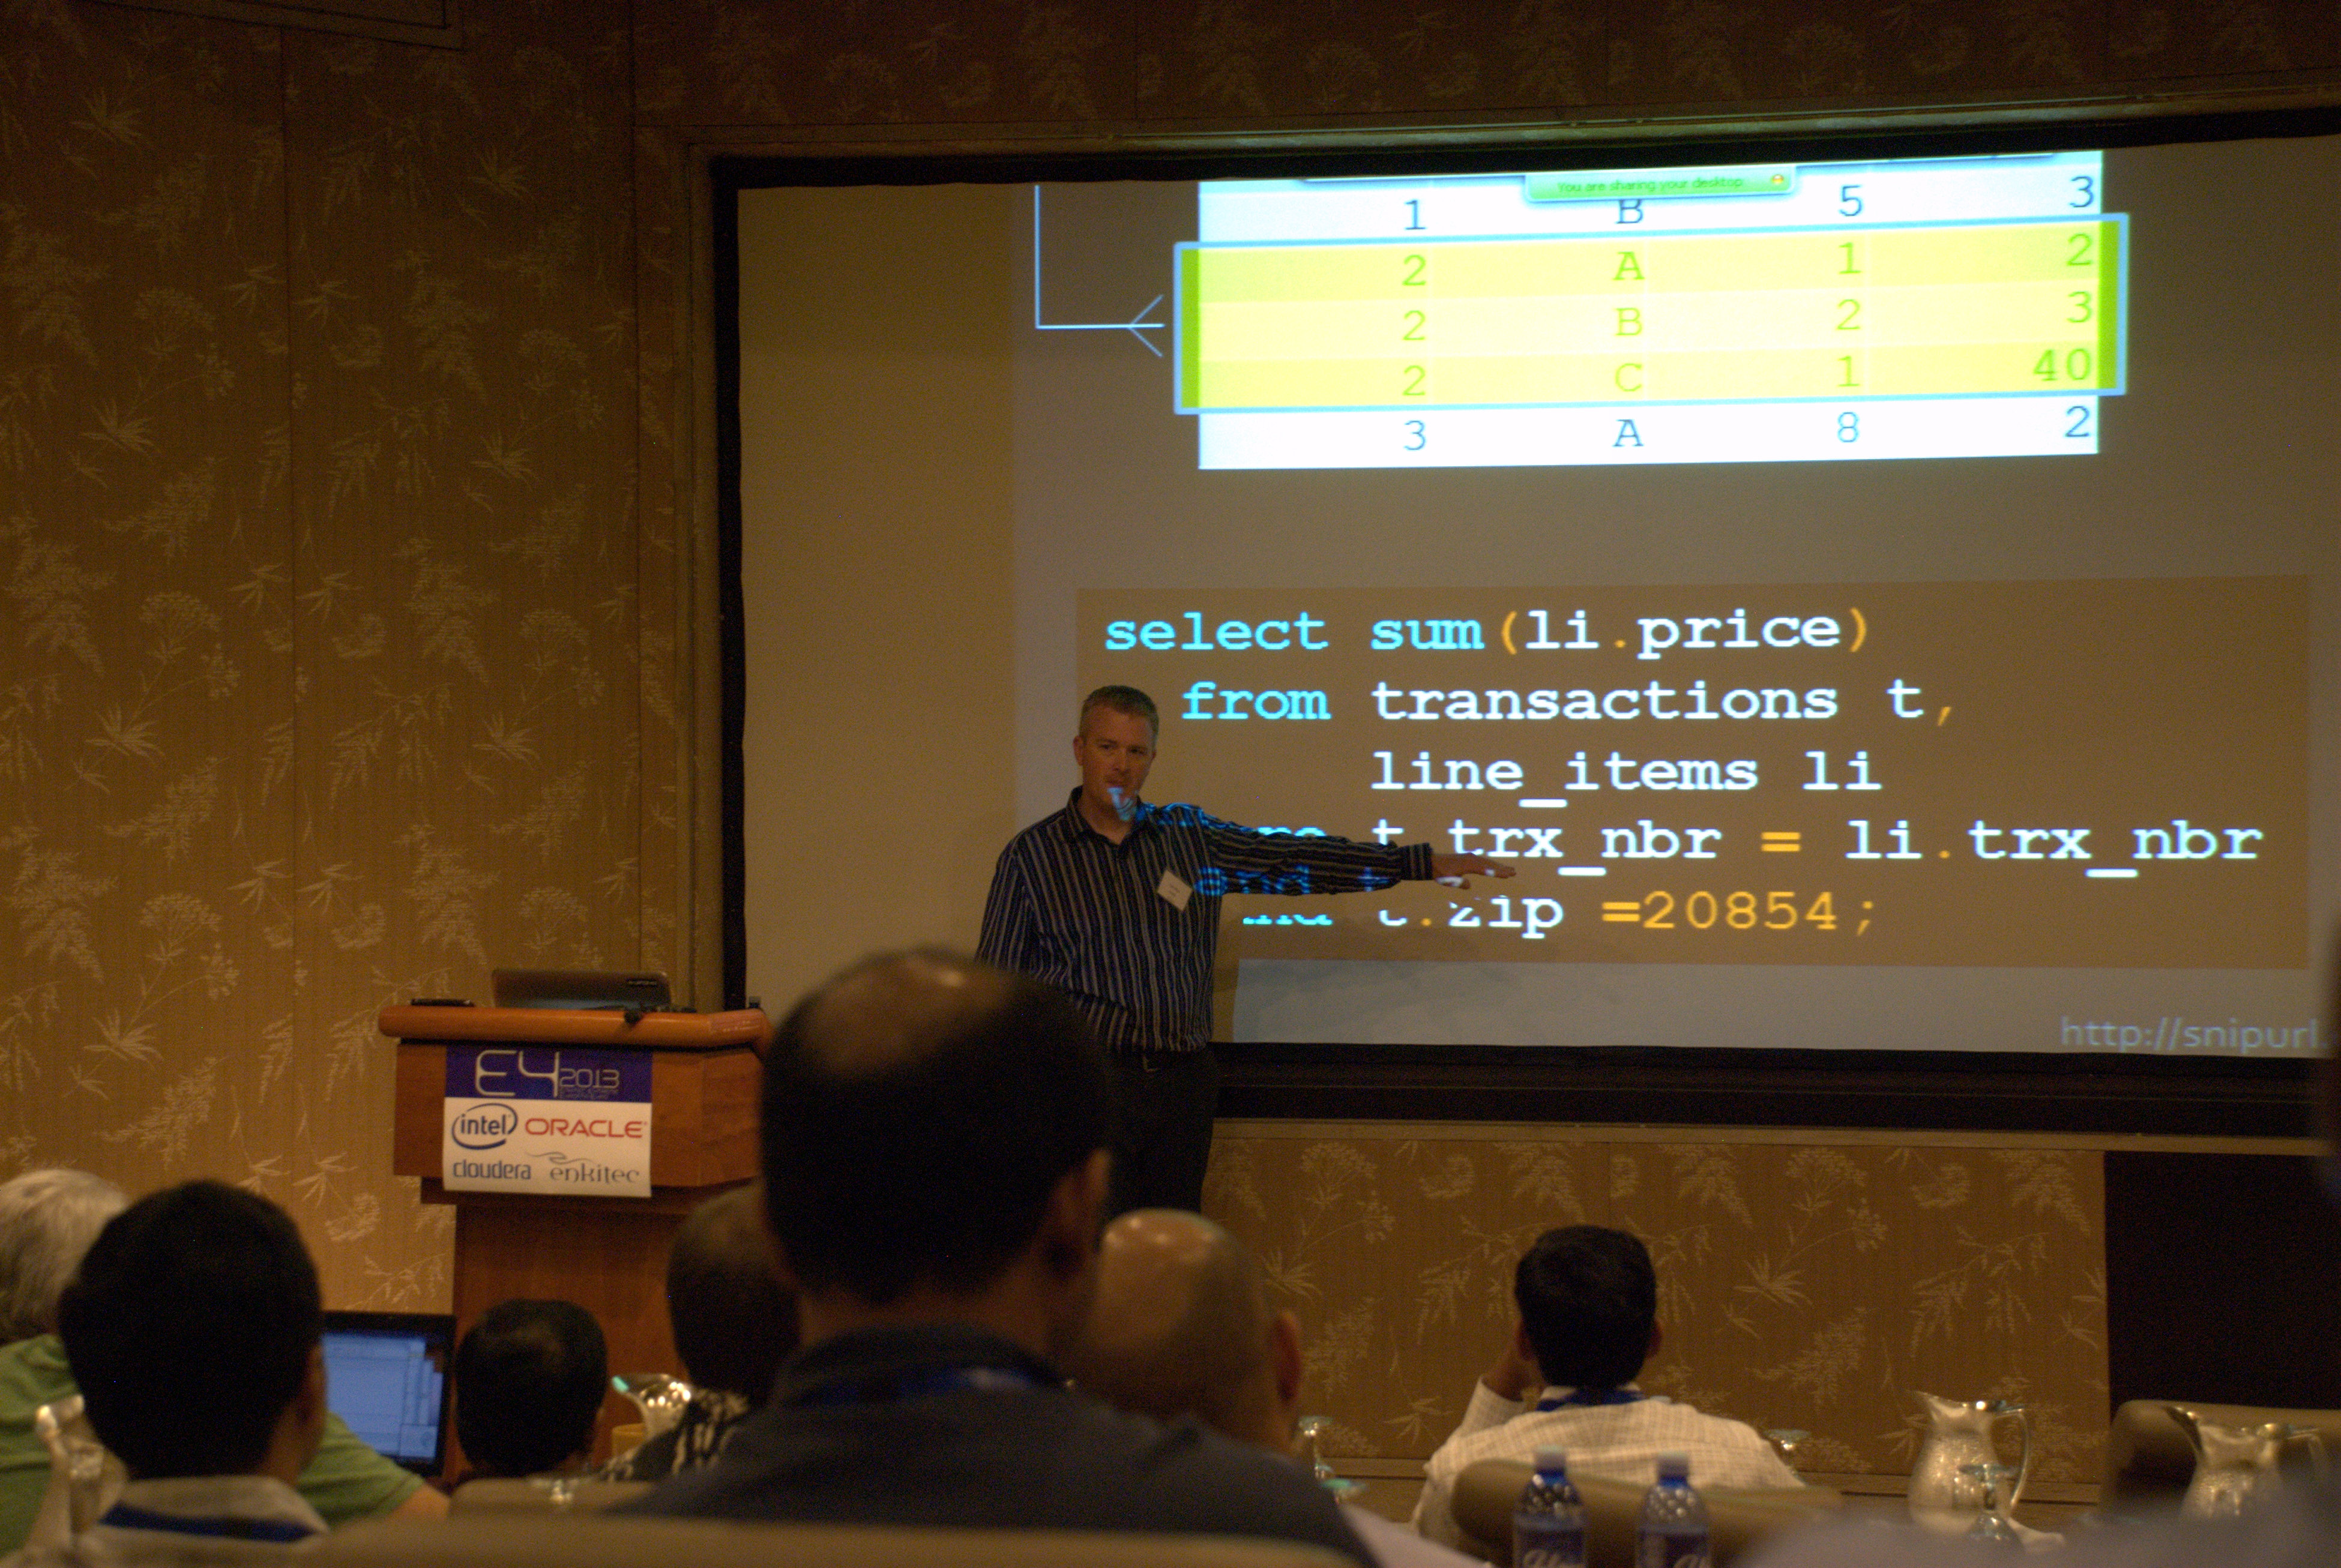
Tyler Muth – Bloom Filters on Exadata
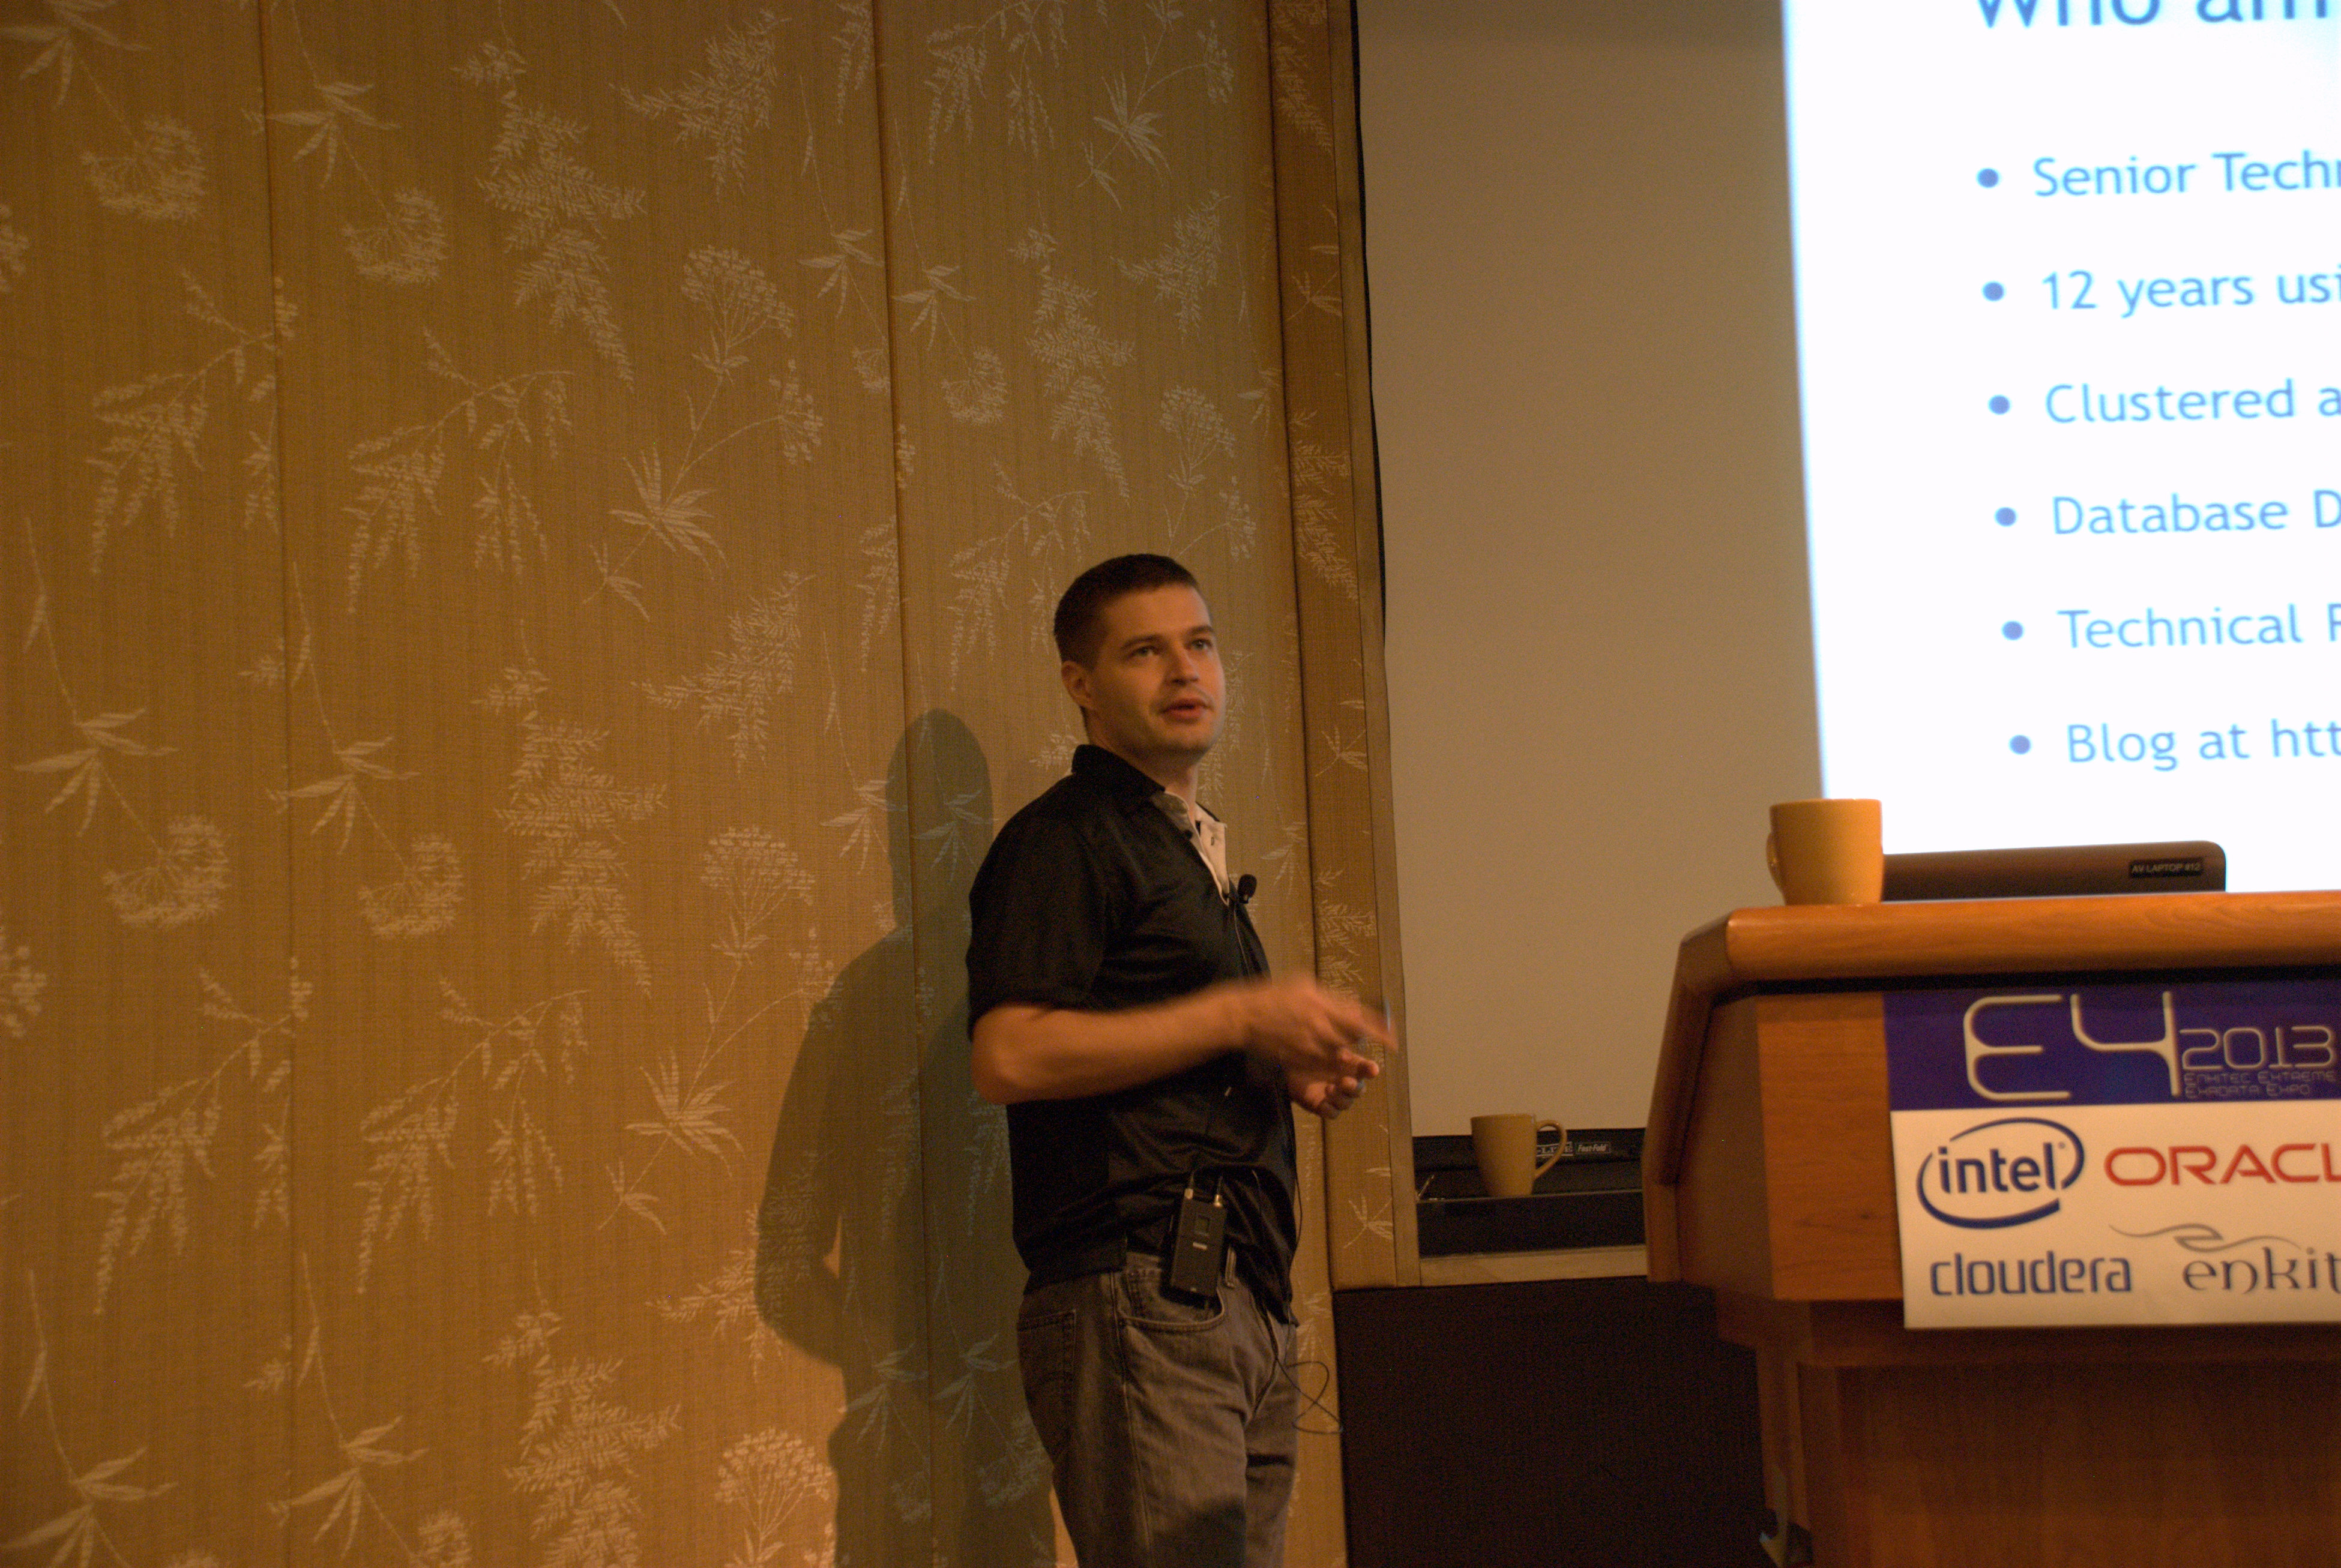
Alex Fatkulin – DBFS Performance
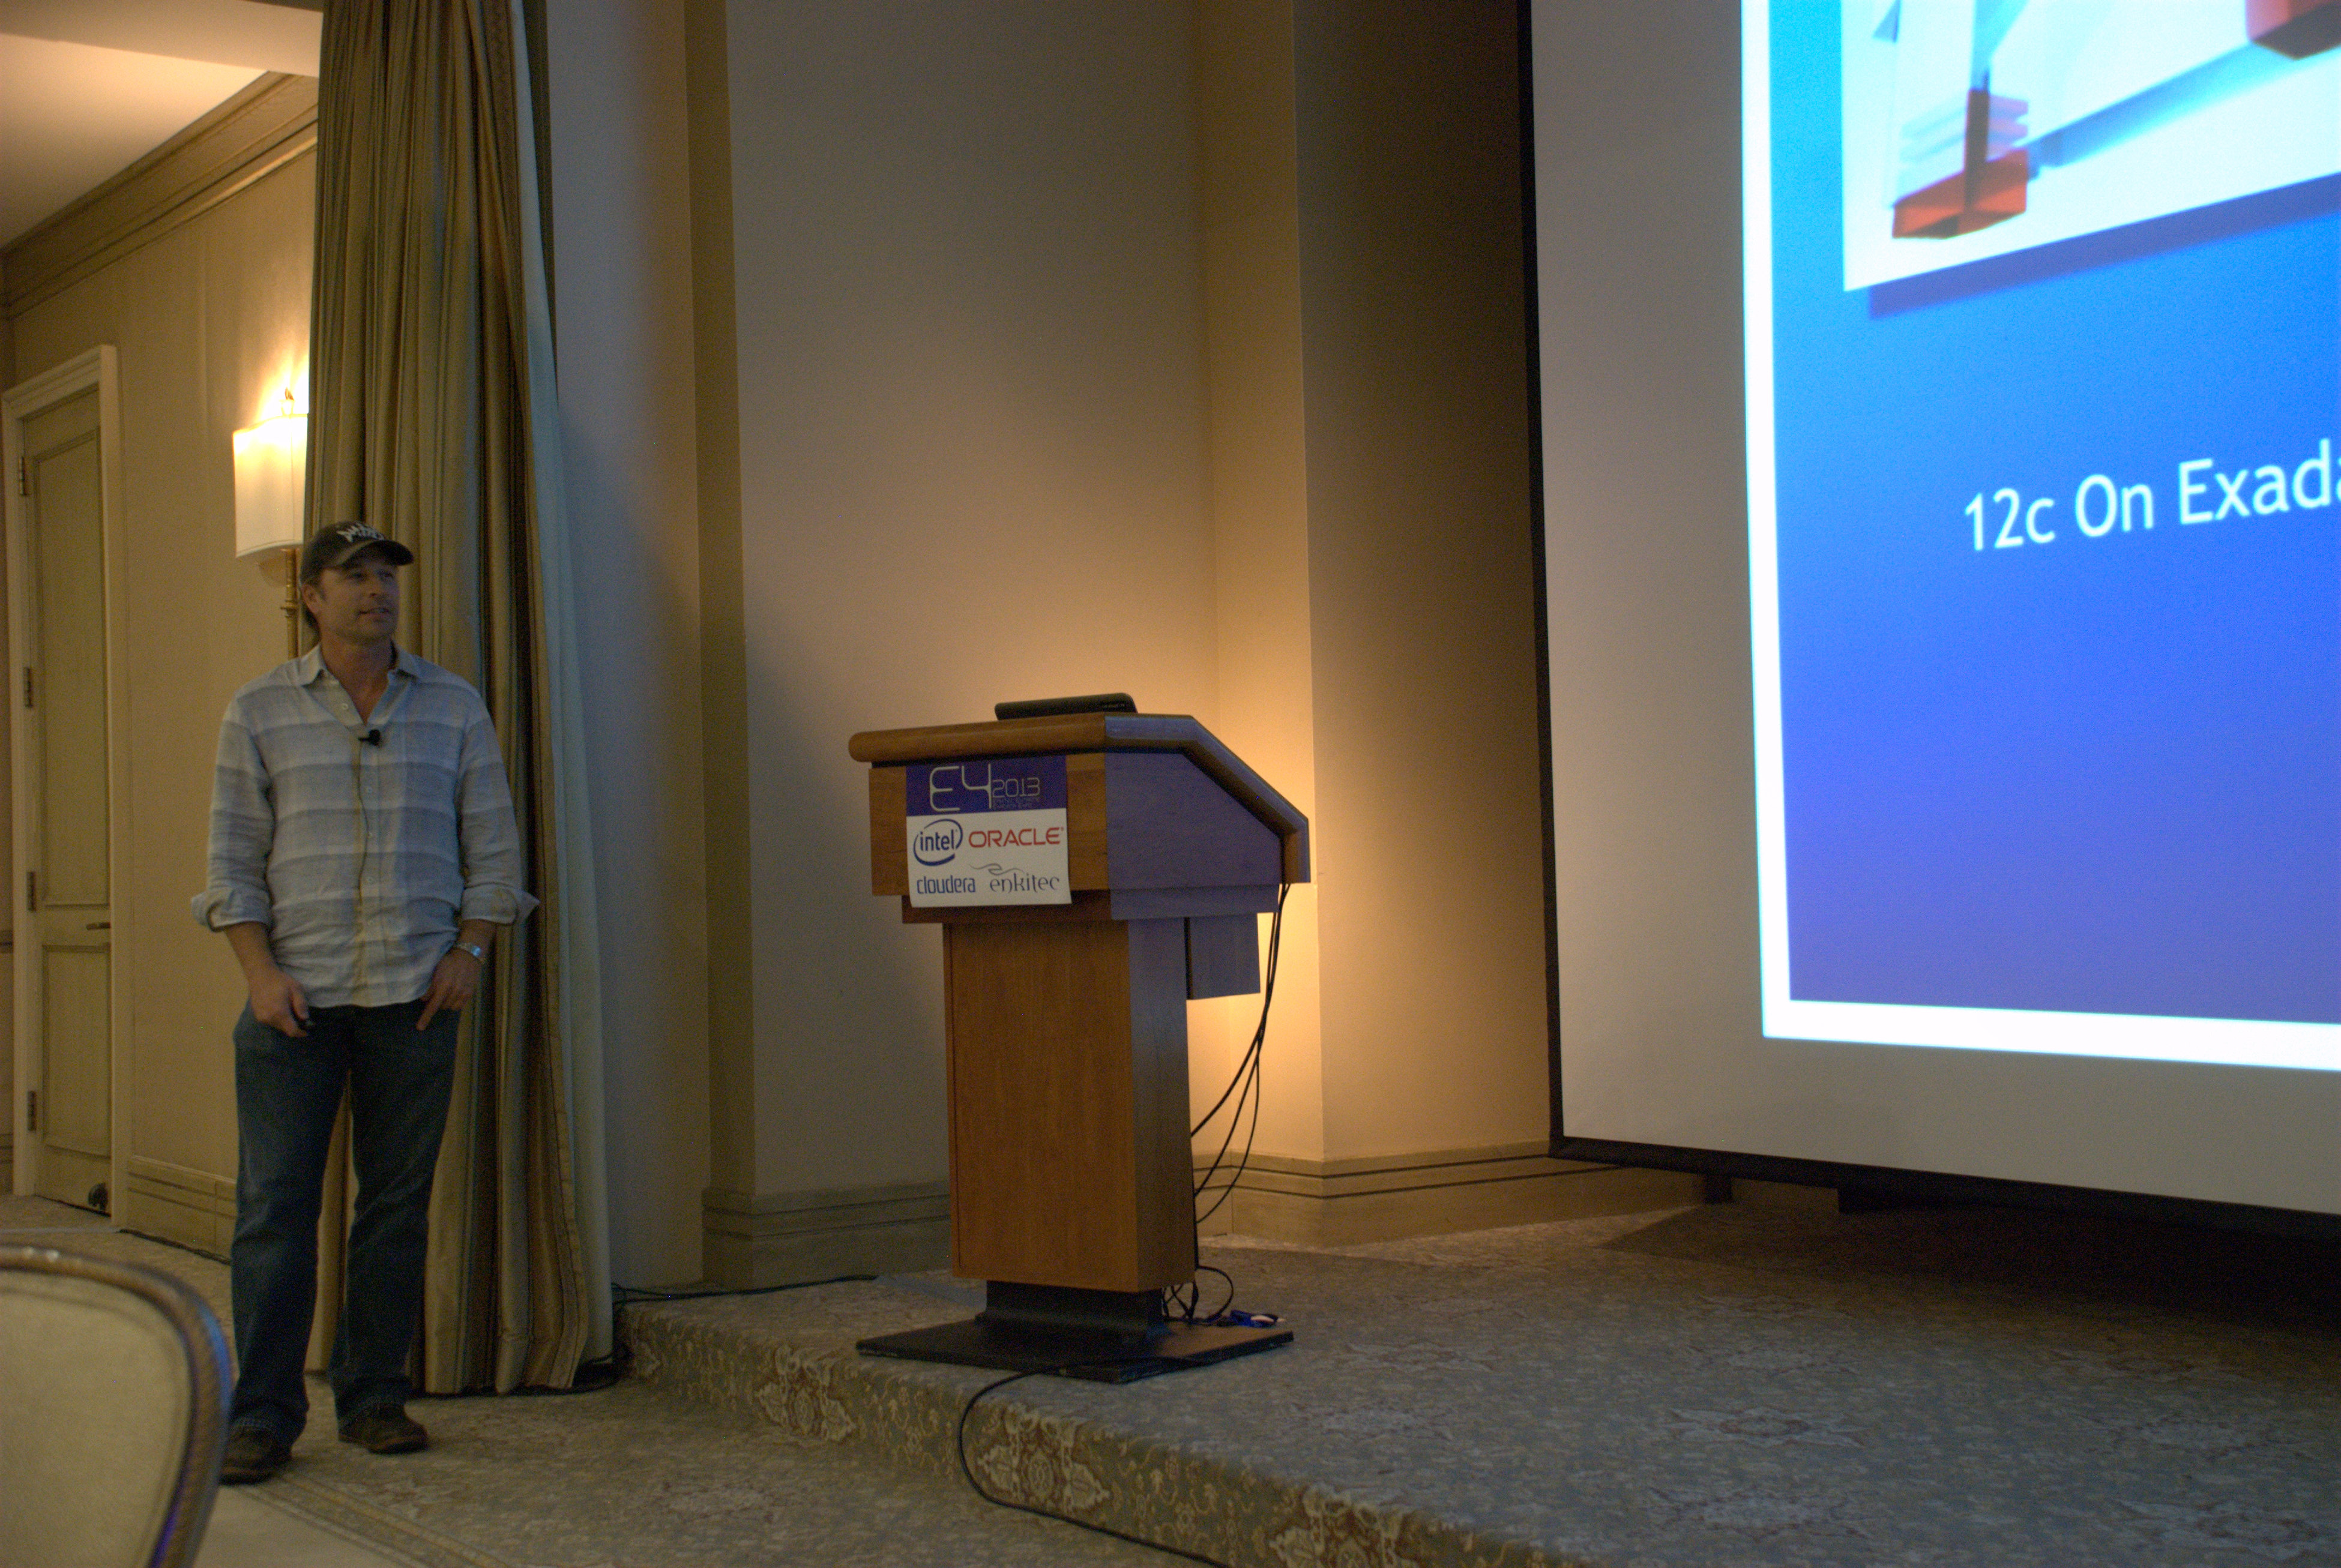
Kerry Osborne – Oracle Database 12c on Exadata

Ferhat Sengonul – Exadata Ecosystem in Turkcell

Sue Lee – Resource Management
E4 Day 1
I am attending E4. What is E4? Well, it is Enkitec’s annual conference on Exadata. To me, it is a professional forum to share knowledge on Exadata and related topics. This year the attendees are about 150 in-person and about 100 remotely. A good size for a successful and cozy conference. What I like about E4 is that it focuses on technical issues skipping all the marketing and sales stuff. A technical conference for technical people. Another important characteristic is the environment: relaxed, open, positive, camaraderie, etc. So, if you missed E4 this year, plan ahead to attend next year!
On E4 day 1, we had great speakers and cool topics. Just take a look at the agenda. What I liked most about all speakers was that all have been down to earth. I enjoy learning from the best of the field within this kind of framework.
Exadata is captivating (complex, challenging, rewarding, etc.). I also learned yesterday about Tableau, which I will test with SQLTXPLAIN data out of SQLDX (ASH).
Sharing some pictures from the conference:

Tim Fox – Real World Parallelism on Exadata

Tanel Poder – Real World Parallelism on Exadata
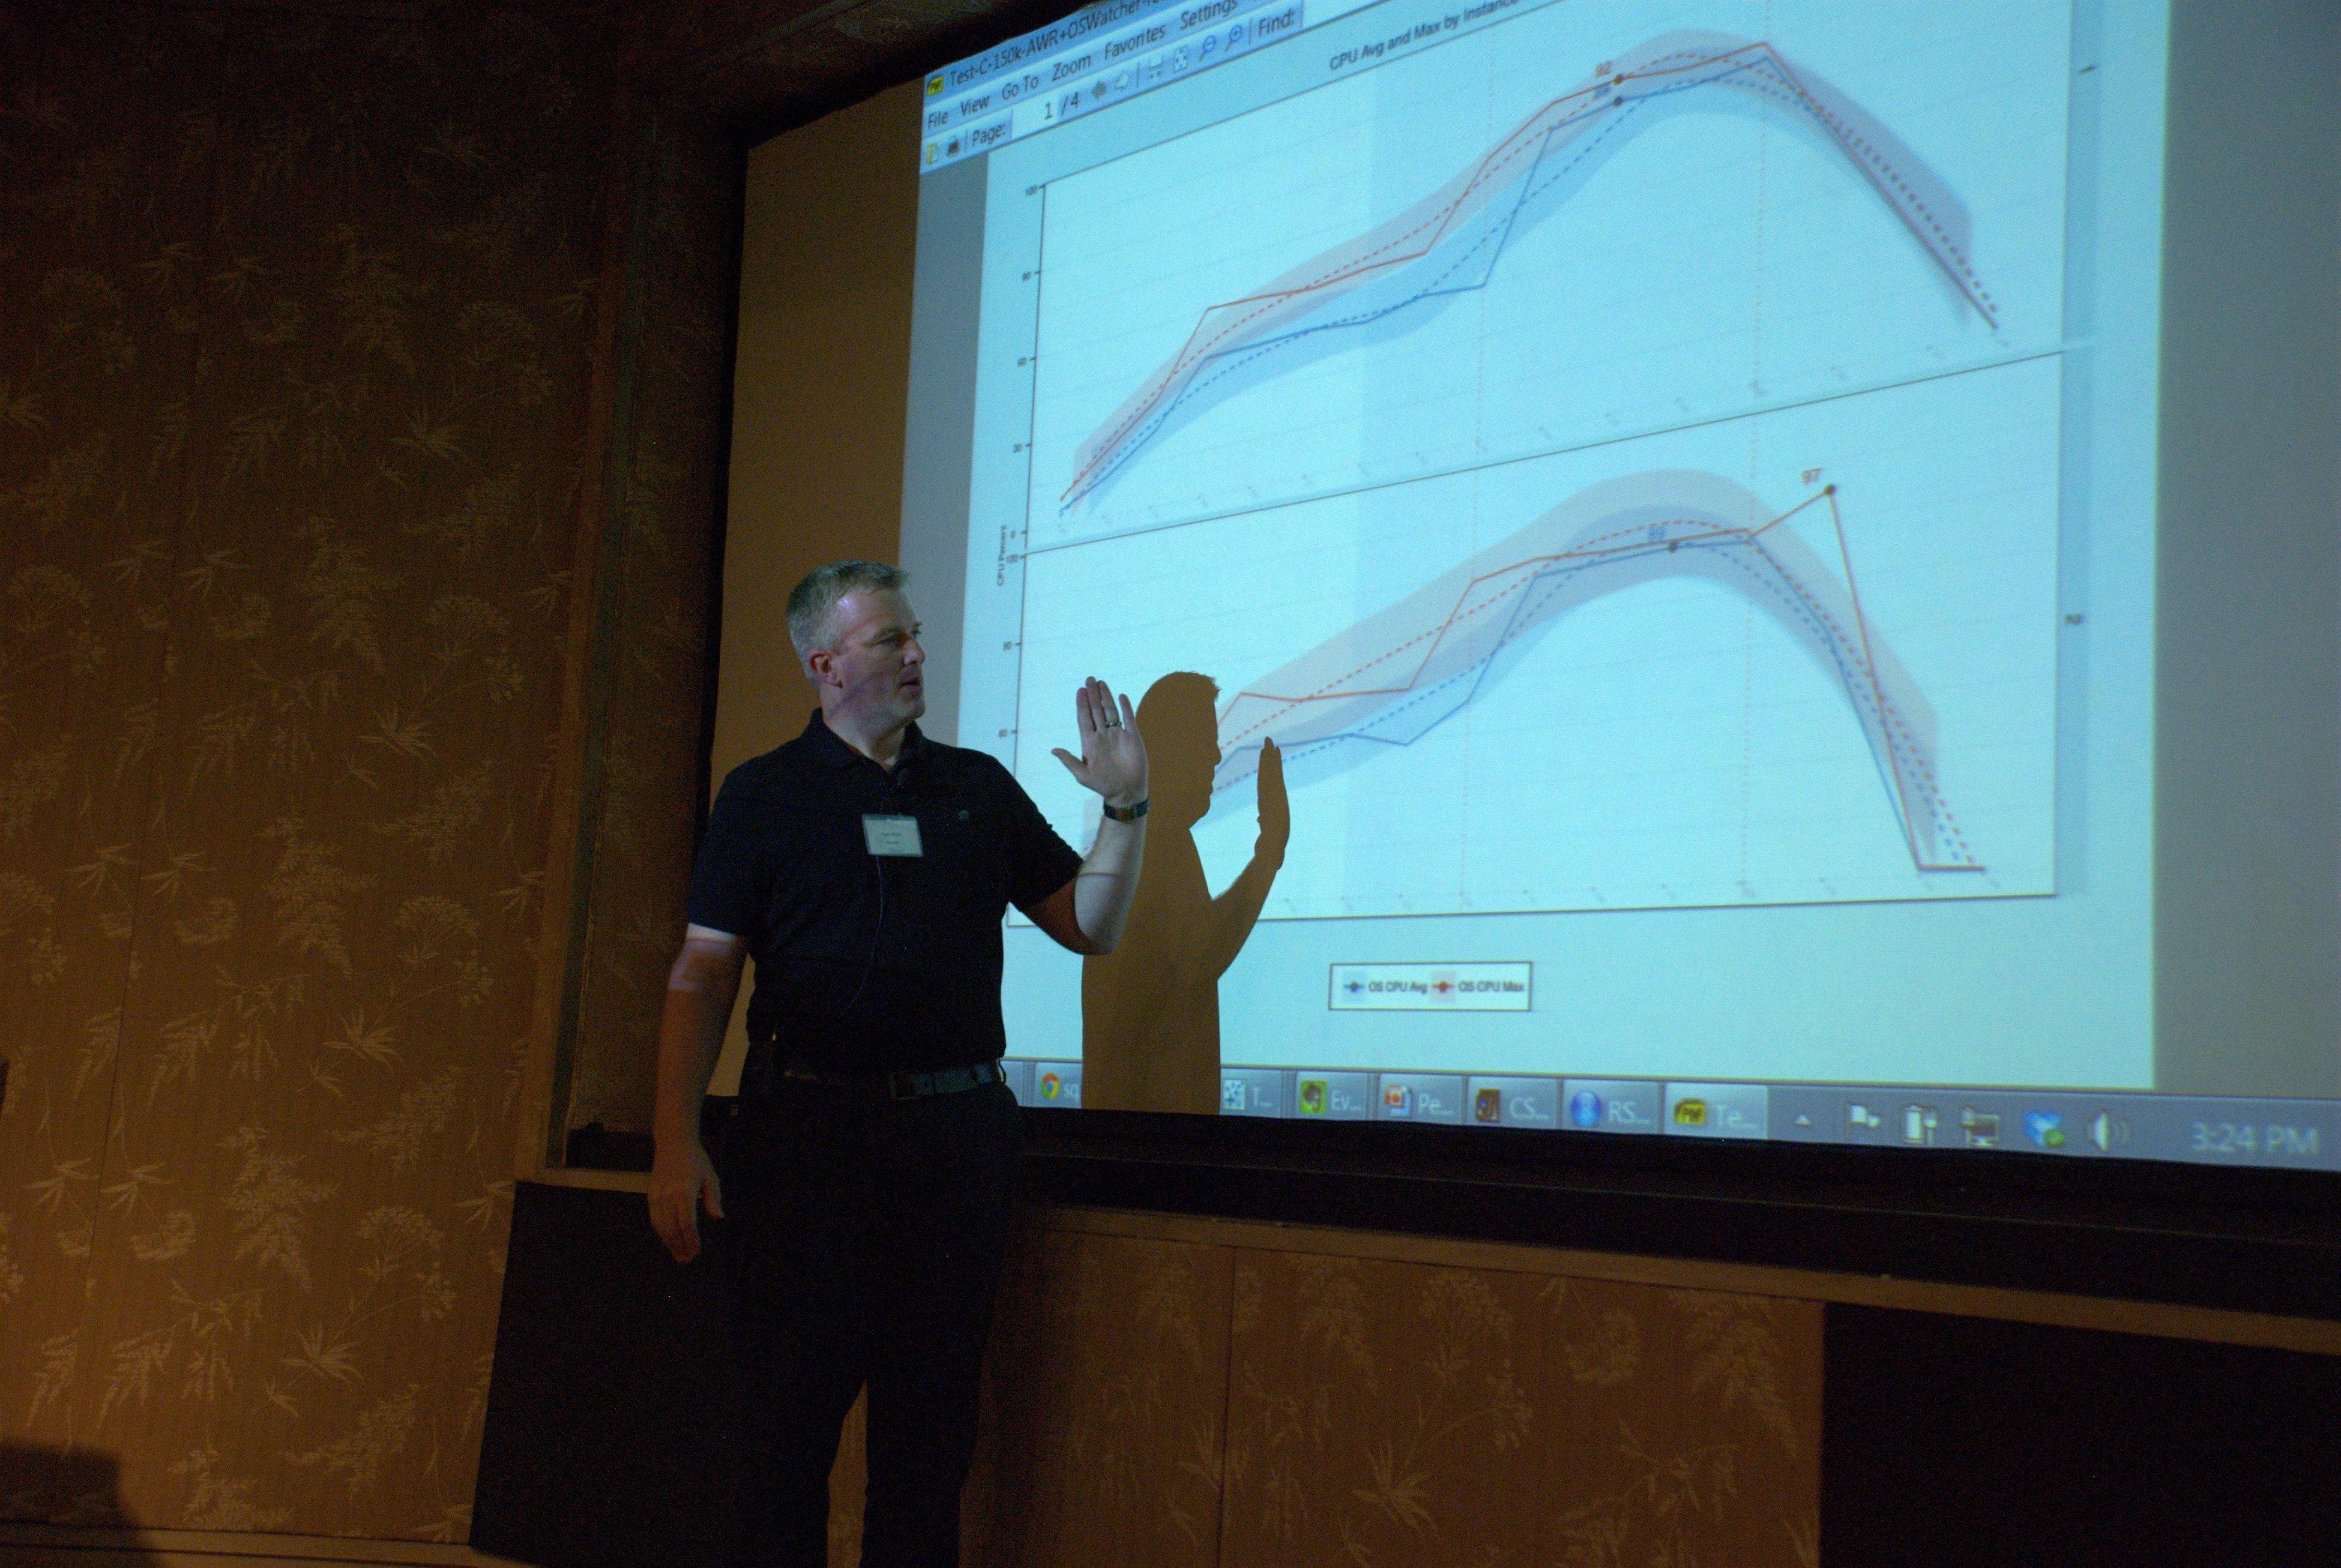
Tyler Muth – Performance Data Visualization with Oracle R and Tableau

Karl Arao – Performance Data Visualization with Oracle R and Tableau
Roger MacNicol – Exadata SmartScan Deep Dive

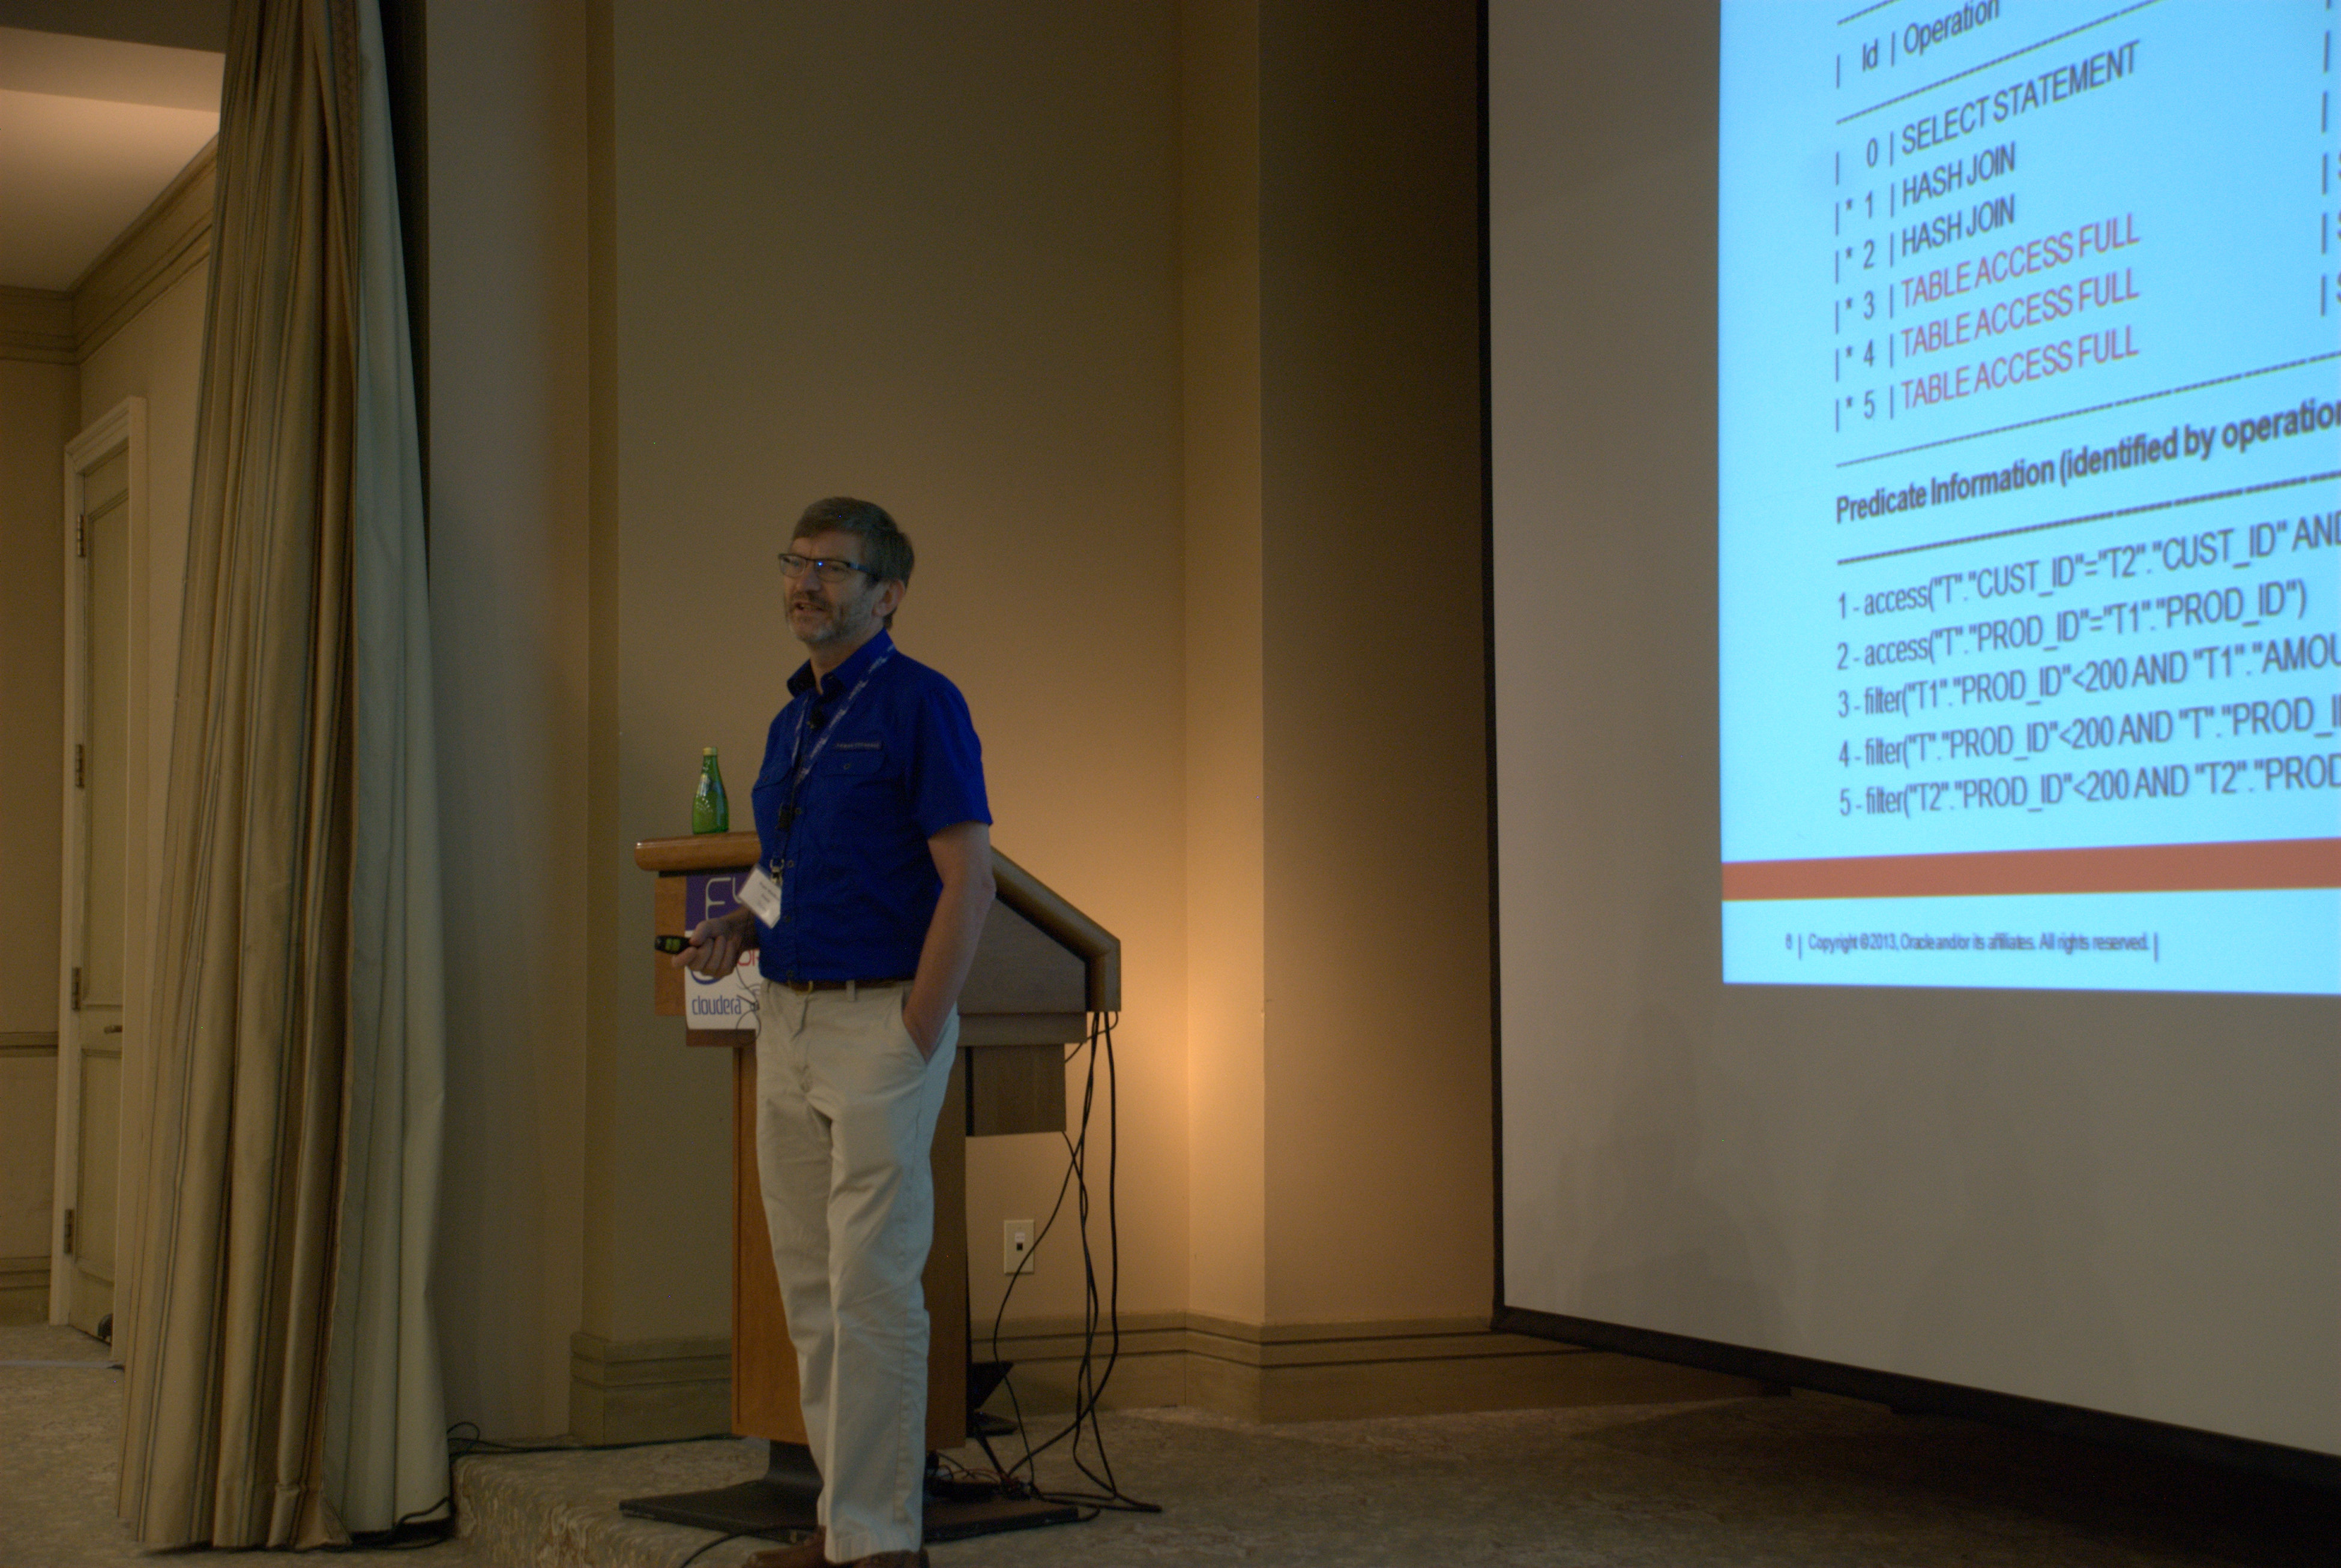
Maria Colgan – Explaining the Exadata Explain Plan

Tom Kyte – Oracle Exadata Keynote
Two common mistakes using METHOD_OPT in DBMS_STATS
When gathering Cost-based Optimizer (CBO) statistics for a Table, most probably you use DBMS_STATS directly (unless your application is EBS, PSFT or Siebel). There are a couple of common mistakes we see around the use of the METHOD_OPT parameter on GATHER APIs out of this DBMS_STATS package.
METHOD_OPT => ‘FOR ALL INDEXED COLUMNS SIZE…’
With this parameter value DBMS_STATS gathers statistics ONLY in columns referenced in at least one index. So, any column that is not referenced by an index does NOT get any new statistics. The misconception is that if we specify let’s say SIZE AUTO or SIZE 254, we would get Histograms for indexed columns and regular statistics (with no Histograms) for the rest of the columns. This is not the case. We simple do not get new statistics for those columns which are not referenced by an index.
WHY is this a problem? Well, if your query has predicates referencing a non-indexed column, the CBO still has to figure out the Selectivity for the predicate. With outdated statistics or no statistics at all, this Selectivity may not be accurate and your plan may suffer.
If you are thinking “if I have no statistics on a column then Dynamic Sampling will kick in” you may be overlooking the fact that in most cases Dynamic Sampling ONLY gets invoked if your Table has no statistics. In a case like this the Table has statistics (DBA_TABLES) but the column of interest may not (DBA_TABL_COLUMNS). In other words, Dynamic Sampling is not the answer here. What you really want is to stay away of “FOR ALL INDEXED COLUMNS“. You want to use instead “FOR ALL COLUMNS“.
Note: Siebel is an exception since Siebel requires all columns ever used on a predicate to have at least one index. Not that I agree with this policy, but if actually implemented then gathering statistics in all indexed columns is just fine.
METHOD_OPT => NULL
If you are using a tool or a script to dynamically generate the DBMS_STATS.GATHER_TABLE_STATS command to gather Table statistics, you may have a front-end or set of input parameters to specify HOW the user of your tool/script wants to gather statistics. A common mistake (I made it myself some time back), is to pass parameter “METHOD_OPT => NULL” (when the user does not specify anything for method). Be aware that passing a NULL in this parameter means: gather statistics for the Table (DBA_TABLES) but nothing for the Columns (DBA_TAB_COLUMNS). In other words, the statistics for Table Columns do not get refreshed, preserving their old values.
On 10g and 11g using “METHOD_OPT => NULL” is wrong since we end-up with outdated and out of sync statistics. Of course this has a negative effect in our execution plans. On 12c it seems the behavior is different. I did some testings and on 12c it seems that we get refreshed column statistics even if we pass a NULL. But if you are on 10g or 11g be aware of this common mistake. What you want to do instead is to NOT pass this parameter at. If the parameter is not passed at all, then it gets a default value that basically means: gather statistics in all columns, but in those referenced by at least one predicate, collect Histograms. This default value is usually fine, and in any case it is what you intended when you were passing NULL in the first place.
Conclusion
Gathering CBO statistics calling DBMS_STATS.GATHER_TABLE_STATS with METHOD_OPT => ‘FOR ALL INDEXED COLUMNS…” or passing a value of NULL are common mistakes. You don’t see the detrimental effects right away. But as the column statistics become gradually older and older, some of your execution plans start to change. The symptoms are: unexpected poorly performing plans pop-up once in a while. The remedy is simple: avoid these two common mistakes!
Keep always in mind: statistics that closely represent your data improve the chances for the CBO to generate an optimal plan. I always think of the CBO as an old temperamental lady: be nice to her and she may be nice to you in return 😉
Carlos Sierra is joining Enkitec soon
In a few days I will be joining Enkitec. Sure I will miss Oracle after 17 good years there. I made some really good friends and I learned a lot. I had the opportunity to build tools I thought were needed by the Oracle community, and I am glad they are been deployed all over the world. I am also pleased to know all these tools will continue helping our SQL Tuning community with no disruption.
A question I am often asked is: WHY Enkitec? I could elaborate on an answer but to keep it short, I would simply say “because I like the idea of contributing to an expanding team of outstanding professionals in the Oracle space“. I also value the close relationship between Enkitec and Oracle. I see this as a win-win.
At Enkitec I will be doing a lot of stuff. My main focus at the beginning will be database performance in general and SQL Tuning in particular. I foresee the possibility to open some SQL Tuning hands-on workshops using SQLTXPLAIN, SQLHC and some other cool tools and techniques. I also expect some additional duties and new areas of expertise to develop, which I embrace as new challenges and opportunities.
Overall, I feel very excited and ready to start walking this new career path. What can I say… Just when I though life was good it simply got better!
You know how to reach me (here) or by email.
Cheers — Carlos
Gathering CBO Statistics in Oracle Applications
When we refer to Oracle Applications we usually think E-Business (EBS), but there are other large Oracle Applications that requires some special consideration when it comes to CBO Statistics gathering: Siebel and People Soft (PSFT). There are some others, but I would say EBS, Siebel and PSFT make the bulk of them all.
Gathering Stats on EBS
This is easy, since the only supported method is FND_STATS. That means using plain DBMS_STATS and ANALYZE is simply not supported. FND_STATS is a wrapper on top of DBMS_STATS that includes some extra functionality. The most important addition is controlling which columns get Histograms. The set of columns EBS requires to have Histograms is small and well controlled. FND_STATS can be executed from within the application (Concurrent Request, i.e. batch job) or directly from SQL*Plus.
If you are using EBS, then be sure FND_STATS is the only active method to gather statistics. In other words, automatic jobs to gather statistics using DBMS_STATS or custom scripts must be disabled.
Gathering Stats on Siebel
Siebel documents how CBO statistics must be gathered in white paper titled “Performance Tuning Guidelines for Siebel CRM Applications on Oracle Database“. This paper is authored by “James Qiu, Paul Blokhin, Mehdi Gerami” (Oracle Development) and its latest version is dated December, 2010. It was rewritten back on 2010 with the contribution of Abel Macias, Dave Henriquez and myself. Out of this paper we created the coe_siebel_stats.sql and the coe_siebel_profile.sql scripts. Both are well documented. Please refer to Metalink (MOS) note 781927.1 to download the latest version of the white paper and the actual scripts.
If you are using Siebel on databases 10.2 or higher, you really want to follow the white paper provided in MOS 781927.1 and implement coe_siebel_stats.sql. We have noticed that since its inception a couple of years ago, the number of performance issues reported in Siebel applications has been reduced significantly.
Gathering Stats on PSFT
For PeopleTools 8.49 and higher, on databases 10.2.0.4 and higher, I recommend the use of Metalink (MOS) note 1322888.1 (Improving Statistics in Oracle RDBMS for PeopleSoft Enterprise). The author of this note is John Houghton, who works for the Center of Expertise (CoE) in the PSFT side of the house. In this MOS note you will find a zip file that contains a couple of documents explaining how to use script pscbo_stats.sql and it also contains the actual script. There is some implementation effort, but once pscbo_stats.sql is implemented your CBO statistics are gathered following best practices for PSFT. I had the opportunity to collaborate with John in the creation and testing of this pscbo_stats.sql script. It is currently on its 2nd major release.
If you are on PSFT 8.49 or higher, you want to implement pscbo_stats.sql out of MOS 1322888.1. Feedback on the results of using this tool have been positive in most cases.
Conclusion
The Cost-based Optimizer (CBO) requires to input good statistics in order to produce an optimal plan. In the perfect world we would use DBMS_STATS with no parameters. Still, some specific application design characteristics, like very skewed data or the use of small tables and temporary tables, require a specif setup to gather statistics tailored to the needs of these applications. All FND_STATS, coe_siebel_stats.sql and pscbo_stats.sql are wrappers on top of DBMS_STATS that incorporate fine granularity use of DBMS_STATS parameters to gather statistics better suited to their application. For EBS the use of FND_STATS is a must, for the other two the use of their corresponding scripts are not a must but strongly recommended.
