About SQLT Repository
SQLTXPLAIN maintains a repository of metadata associated to a SQL statement being analyzed. A subset of this SQLT repository is automatically exported every time one of the main methods (like XTRACT) is used. A question sometimes I get is: what do you do with this SQLT repository? Well, in most cases: nothing. That is because most of the diagnostics we need are already included in the main report. But in some very particular cases we may want to dig into the SQLT repository. For example, in a recent case I wanted to understand some patterns about a particular wait event that happen to become “slower” after the application of an Exadata patch. Then, when IO Resource Manager IORM was configured from Basic to Auto, these waits became “fast” again. How to measure that? How to observe any trends and correlated to the times when the patch was applied and then when the IORM was adjusted? Fortunately SQLT had been used, and it captured ASH data out of AWR before it aged out. So I was able to use it in order to get to “see” these trends below.
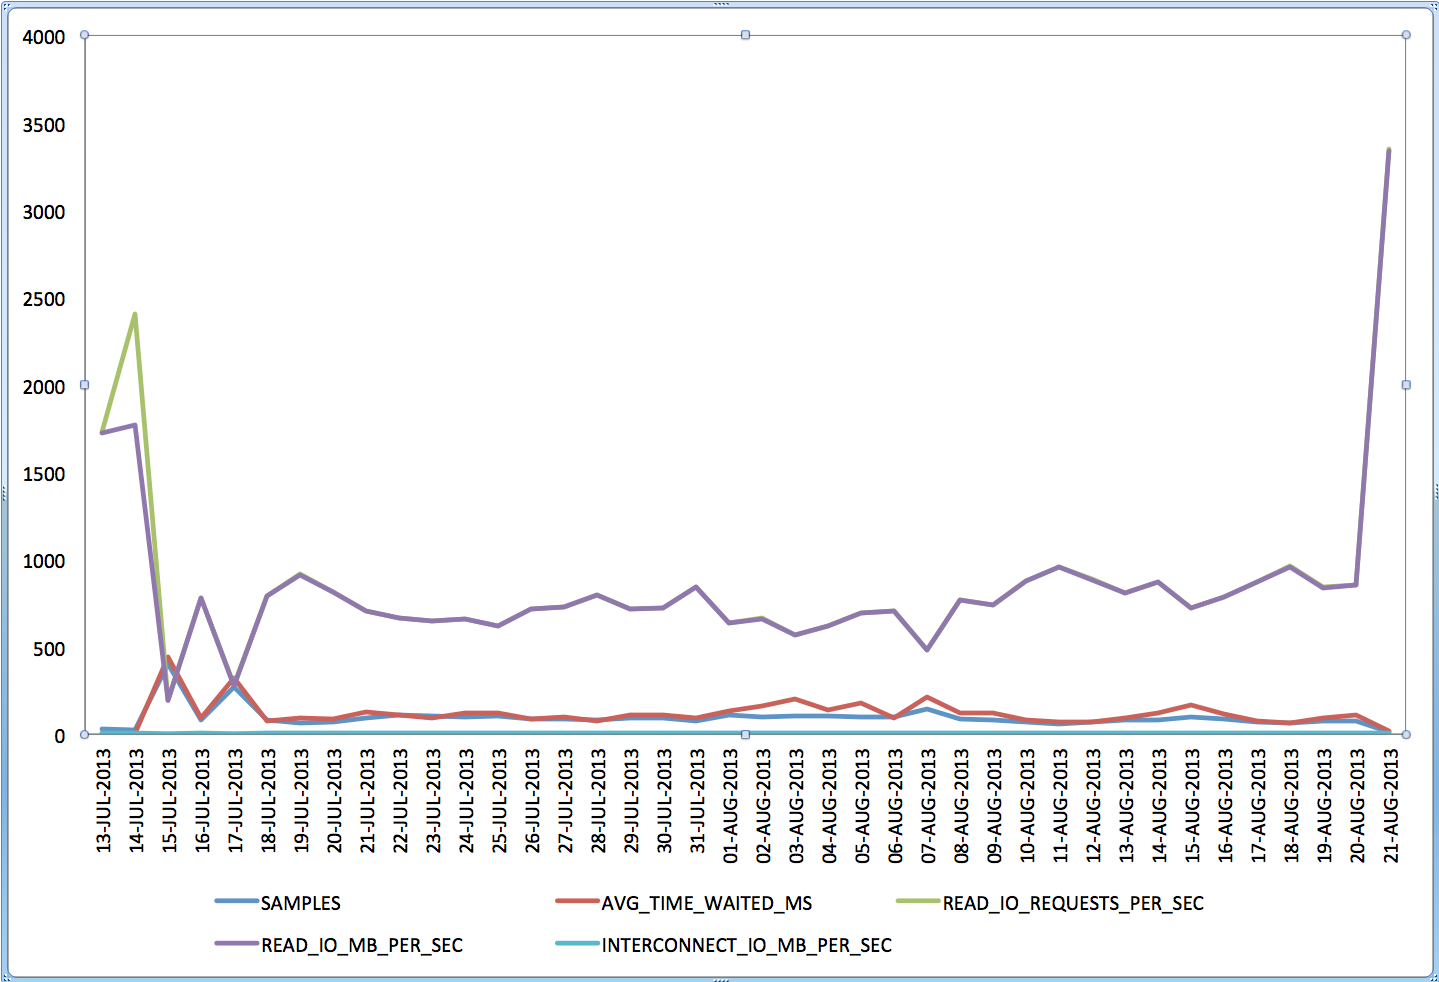
Now the question becomes: How do I produce this kind of graph? Well, with Excel it is easy, we just need to bring the piece of the SQLT repository that we want into Excel. For that, I first import the whole SQLT repository for a given sqlt_sNNNNN_*.zip file into my local SQLT repository. The command is spelled out in the sqlt_sNNNNN_readme.html as “import SQLT repository”, then I just use SQL Developer to export the output of a query into XLS (or CSV). In this case the SQL I used was the one below.
If you try to use the SQLT repository for some similar data analysis and you struggle with it, please let me know and I will help you out.
WITH awr_ash AS (
SELECT DISTINCT -- two or more statements can include same snaps
 sample_time,
 sql_plan_hash_value,
 sql_plan_line_id,
 wait_class,
 event,
 time_waited,
 ROUND(time_waited / 1e3) time_waited_ms,
 current_obj#,
 machine,
 delta_time,
 delta_read_io_requests,
 delta_write_io_requests,
 delta_read_io_bytes,
 delta_write_io_bytes,
 delta_interconnect_io_bytes,
 ROUND(delta_read_io_requests / (delta_time / 1e6)) read_io_requests_per_sec,
 ROUND(delta_write_io_requests / (delta_time / 1e6)) write_io_requests_per_sec,
 ROUND(delta_read_io_bytes / (delta_time / 1e6)) read_io_bytes_per_sec,
 ROUND(delta_write_io_bytes / (delta_time / 1e6)) write_io_bytes_per_sec,
 ROUND(delta_interconnect_io_bytes / (delta_time / 1e6)) interconnect_io_bytes_per_sec
 FROM sqlt$_dba_hist_active_sess_his
 WHERE statement_id IN (90959, 90960, 90962, 90963)
 AND session_state = 'WAITING'
 AND time_waited > 0
 AND delta_time > 0
 AND wait_class IS NOT NULL ),
awr_ash_grp AS (
SELECT TRUNC(sample_time) sample_day,
 event,
 COUNT(*) samples,
 ROUND(AVG(time_waited_ms)) avg_time_waited_ms,
 ROUND(AVG(read_io_requests_per_sec)) read_io_requests_per_sec,
 ROUND(AVG(write_io_requests_per_sec)) write_io_requests_per_sec,
 ROUND(AVG(read_io_bytes_per_sec)) read_io_bytes_per_sec,
 ROUND(AVG(write_io_bytes_per_sec)) write_io_bytes_per_sec,
 ROUND(AVG(interconnect_io_bytes_per_sec)) interconnect_io_bytes_per_sec
 FROM awr_ash
 GROUP BY
 TRUNC(sample_time),
 event ),
cell_smart_reads AS (
SELECT sample_day,
 TO_CHAR(sample_day, 'DD-MON-YYYY') sample_date,
 samples,
 avg_time_waited_ms,
 read_io_requests_per_sec,
 read_io_bytes_per_sec,
 ROUND(read_io_bytes_per_sec / (1024 * 1024)) read_io_mb_per_sec,
 interconnect_io_bytes_per_sec,
 ROUND(interconnect_io_bytes_per_sec / (1024 * 1024), 1) interconnect_io_mb_per_sec
 FROM awr_ash_grp
 WHERE event = 'cell smart table scan' )
SELECT sample_date,
 samples,
 avg_time_waited_ms,
 read_io_requests_per_sec,
 read_io_mb_per_sec,
 interconnect_io_mb_per_sec
 FROM cell_smart_reads
 ORDER BY
 sample_day;

[…] My colleague, Carlos Sierra, the author of famous SQLT tool, also did excellent analysis for the same issue from SQLT perspective and here is the link to his analysis. […]
AWR is not Enough to Track Down IO Problem on Exadata | My Big Data World
August 23, 2013 at 5:47 pm
Very nice!
Carlos Sierra
August 23, 2013 at 6:03 pm
Carlos, Thanks for sharing “The best Article”
Thanks
Mohammed.
Mohammed Yousuf
August 24, 2013 at 3:01 am
Dear Mr. Carlos Sierra:
One clarification about your SQLT Repository solution in the above blog. Is using Excel the preferred and most flexible method for generating analytical graph from Active Session History (ASH) out of the baseline Automatic Workload Repository (AWR) which is capable to generate necessary analytical graphs? In addition, an Oracle DBA per Oracle Corp. best practices can often use ADDM and other OEM component interfaces to generate vital performance tuning analytical data and graphs to perform various performance tuning diagnoses in order to deliver a high performing solution for the Oracle DBMS. Thank you.
Martins O. Adegoke
August 24, 2013 at 7:17 pm
Dear Martins,
Thanks for the clarification. I totally agree. If when doing an analysis of this kind, and interactive access to the system is provided, the best approach is to use OEM and the analytics functionality with regard to ASH. In the other hand, if interactive access to the system is not granted, or we are analyzing the issue after AWR data has been recycled, and we are lucky to have a SQLT of the SQL of concern, obtained near the time of the event we want to analyze, then in that case using the SQLT repository completely offline, allows us to still perform meaningful performance data analysis. Thanks again for your clarification.
Cheers — Carlos
Carlos Sierra
August 25, 2013 at 8:03 pm
Hi Carlos,
Need your suggestion.
We are facing similar IO performance situation for one of our normal AIX server not exadata. Usually set of reports used to take only 3 hours & now suddenly taking more then 5 hours….there is no changes on hardware level neither patches has done. We found lots of I/O which causing this issue..is there any SQL query available to figure out quickly about I/O utilization & distribution stuff.. Any help would be greatly appreciate.
Thanks
Mohammed.
Mohammed Yousuf
August 27, 2013 at 3:49 am
Mohammed,
Sounds like some SQL out of the reports may had changed execution plan. You want to trace/tkprof those reports and look for expensive SQL, then use SQLT XTRACT on them to see if execution history shows plan changes.
Cheers — Carlos
Carlos Sierra
August 27, 2013 at 4:38 am
Thanks for your response.. I have already done all deep dive analysis for execution plan & other stuff based on your & kerry blogs. it’s look ok to me & not much difference.
I have verified LIO & PIO read also which shows ok.. but number of execution of SQLs was more compare to base line report. one interesting issue found – one of Storage path was dead & all traffic is moving through single path which cause this issue & it’s fixed. then again reports back to normal 3 hours…. but two days back again started report generation for 5 hour even both storage paths are accepting traffic properly.
Still I have doubt only on I/O stuff. which required some more deep dive analysis.
Please suggest on this..
Thanks,
Mohammed
Mohammed Yousuf
August 27, 2013 at 4:52 am
Mohammed,
If number of executions of your SQL has increased, you need to find out where that SQL comes from. I mean, is it recursive from the application or is it non-recursive for example. If you are suspecting IO latency, and if you have the proper license, you can use ASH data recorded into AWR. OEM provides nice interfaces, or you may want to CTAS for the SQL you need to analyze, so you don’t risk losing that history as it gets recycled.
Cheers — Carlos
Carlos Sierra
August 27, 2013 at 5:03 am
I have capture all history data for further analysis..
Observation is this. say example
The difference is this before & after about SQL_id. (I have targeted only top 3 SQl_IDs)
1) SQL_ID – 01 (Before executed 10,000/- times & after it has executed 14,000/- times)
2) SQL_ID – 01 (Before executed 9,000/- times & after it has executed 12,000/- times)
3) SQL_ID – 01 (Before executed 5,000/- times & after it has executed 11,000/- times)
I am searching your email id in our internal directory of Oracle for sending awr reports but not getting email id.
Thanks,
Mohammed.
Oracle Dubai.
Mohammed Yousuf
August 27, 2013 at 5:12 am
Mohammed,
I work now for Enkitec. An Oracle Platinum business partner.
For those 3 SQLs you may want to investigate where they come from. Maybe they are part of a loop in your reports. If they execute at most double of times, then assuming plans have not changed, that could account for up to double elapsed time. If you observe more than that, it is possible the increased number of executions are not the main culprit. I suggest you focus on trace/tkprof for those reports then XTRACT on the ones consuming most of the time.
Cheers — Carlos
Carlos Sierra
August 27, 2013 at 8:29 am