Posts Tagged ‘sql tuning’
SQL Stats Analytics (from SQL*Plus!)
If you have access to some other graphical tool that displays time series on multiple dimensions for one or a set of SQL statements from an Oracle database, then you may not need “SQL Stats Analytics”. In the other hand, if you have no such tool, or even more restricting, if you can only access your Oracle database through some client connection such as SQL*Plus, then you may have some use for the open-source “SQL Stats Analytics” presented here.
Before you go on, a fair warning: this open-source tool reads DBA_HIST_SQLSTAT, therefore it assumes you are licensed to use the Oracle Diagnostics Pack, like when you access any DBA_HIST view. And a second caveat, this tool has been developed and tested on Oracle databases 12.2 and 19c, so it won’t work on older releases. Final note here: SQL Stats Analytics is part of the “CS Scripts” Tool Set (open-source), then you can use any of these scripts “as is”, but they are not actually supported by me or anyone else (they do work although). Feel free to use this part, or any other part of the “CS Scripts” Tool Kit at your own risk, and with the condition that you cannot claim authorship or ownership.
SQL Stats Analytics, similar to the “Poor-man’s version of ASH Analytics” presented on this blog, is a tool to generate, out of a simple SQL*Plus connection (either from a DB server or from a client machine: i.e.: a Term on a Mac or PC), a Chart that provide valuable insights on performance history and patterns, on one or multiple SQL statements of interest. Since a picture is worth a thousand words, I’d rather show some pictures, then explain briefly this tool.
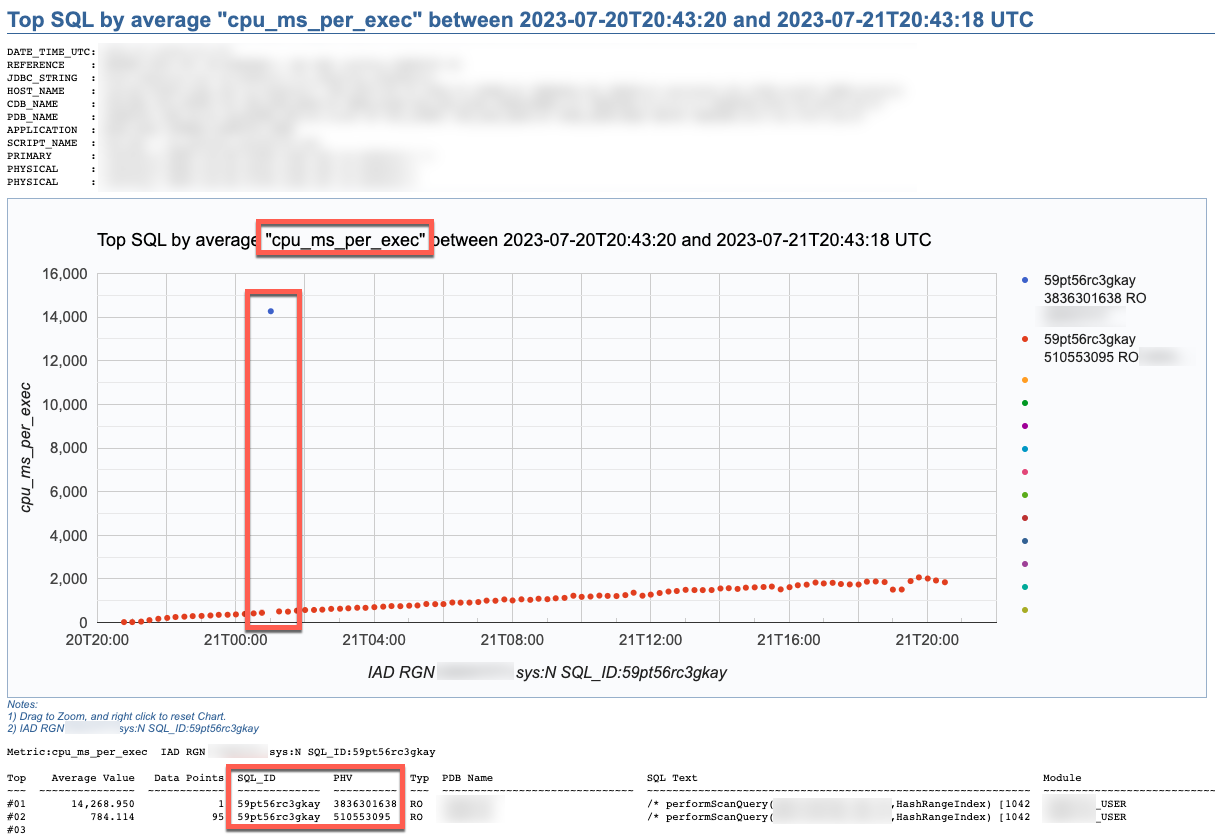

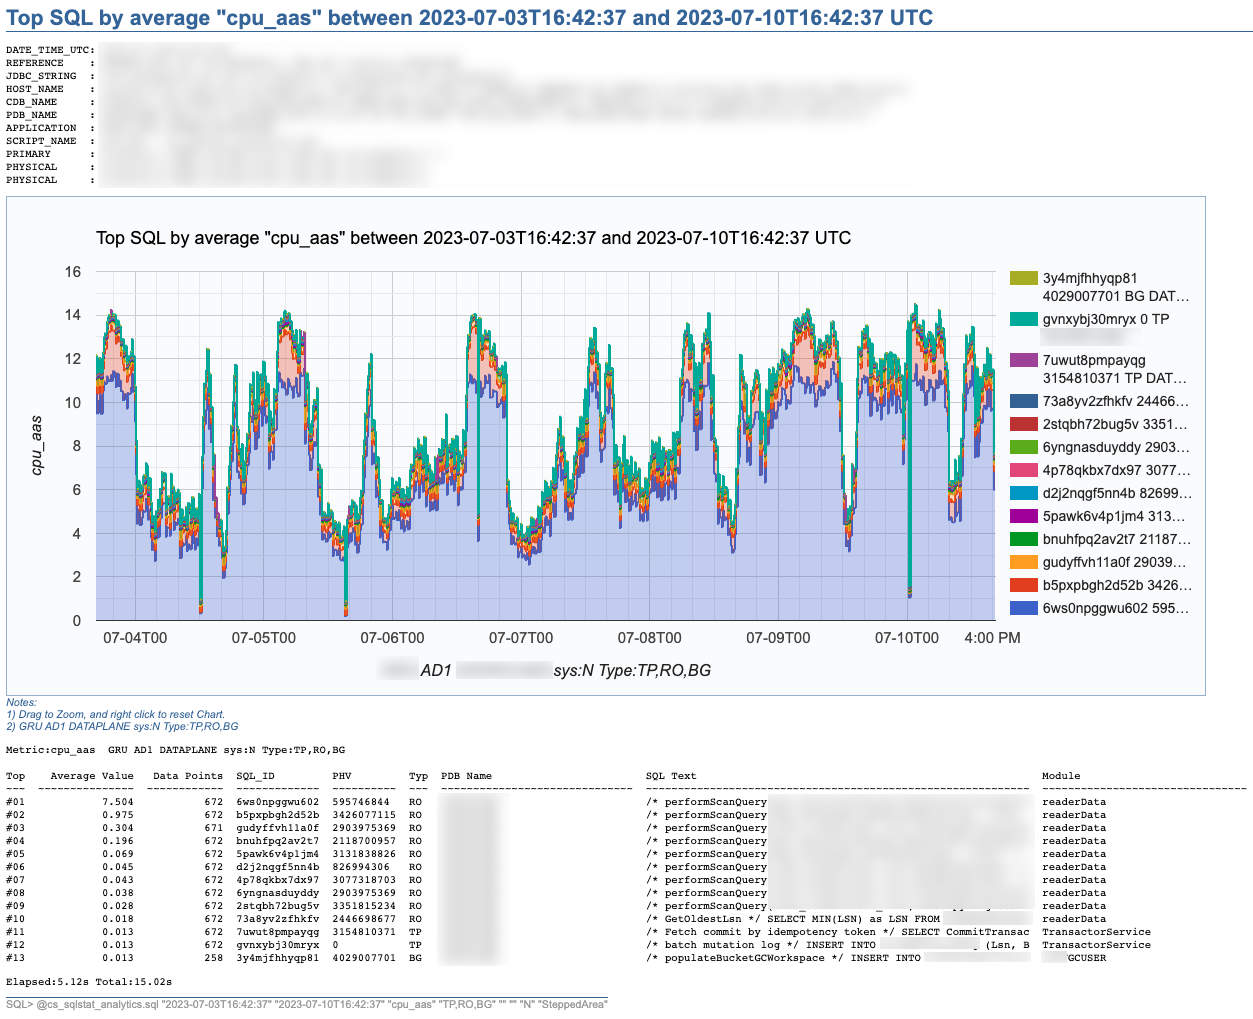
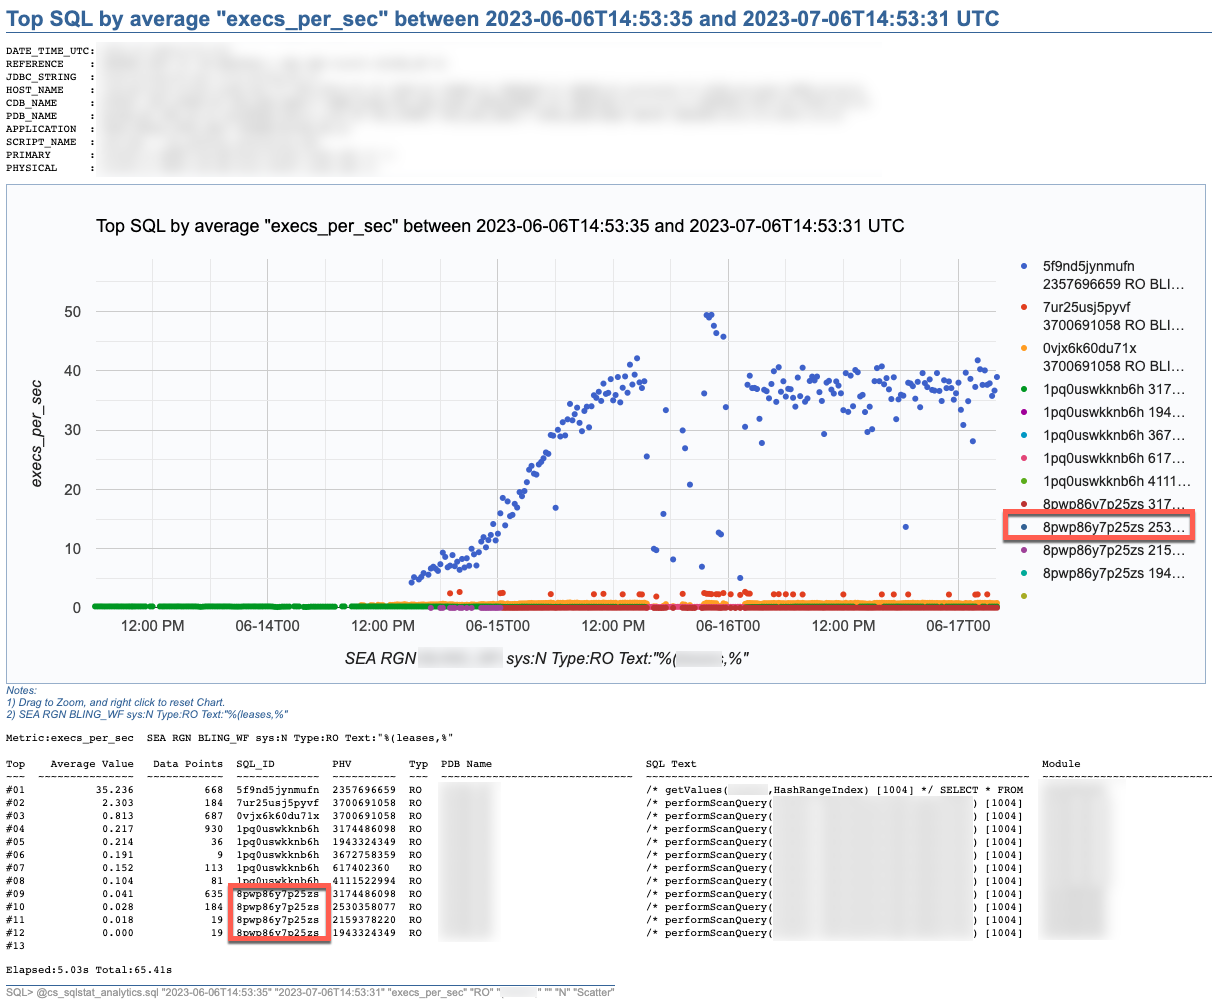
SQL Stats Analytics reads mainly DBA_HIST_SQLSTAT, performs some aggregations to compute multiple SQL statistics, selects the “top” SQL_ID/PLAN_HASH_VALUE pairs as per one selected Statistic, and produces some free Google chart, writing it into a text file to your local SQL*Plus directory where you started SQL*Plus (either on your Term client such as Mac/PC, or your DB server). The generated text file contains plain html, thus it can be opened using any browser. The chart allows some useful zooming on it.
On the “CS Scripts” README.md, you can find this SQL Statistics Analytics as well as its siblings (below). If you want to know what else is there on the “CS Scripts” Tool Set, simply navigate the readme. I do use many of these scripts on a daily basis, and I upload a fresh version to GitHub every so often.

These days I no longer consume SQLT, and I rarely use eDB360 or SQLdb360, since the “CS Scripts” Tool Set gives me everything I need on a piece-by-piece as-needed basis.
The SQL Stats Analytics takes the following input parameters:
- Time From (default to last 7 days)
- Time To (default to now)
- SQL Statistic (exhaustive list of 74 options where most common are: et_ms_per_exec default, et_aas, execs_per_sec, gets_per_exec and rows_per_exec)
- SQL Type (optional SQL categorization, but you may want to just skip this parameter)
- SQL Text piece (optional and case insensitive)
- SQL_ID (optional)
- Include SYS SQL (default to N)
- Graph Type (Scatter default, Line, SteppedArea and Area)
When using the “SQL Text piece” parameter you can focus on a set of SQL statements on a particular application Table, or maybe a SQL predicate of interest. The range of time is limited to your AWR retention (we keep 60 days of history and 15 minutes granularity since defaults of 8 days and 1 hour are not enough for our needs).
If you like this SQL Statistics Analytics script, you may also like the CS Ash Analytics. The former focuses on SQL Performance out of V$SQLSTATS while the latter on SQL Load out of V$ACTIVE_SESSION_HISTORY (and their DBA_HIST views).
Before using any of the CS Scripts, just be sure you are licensed on the Oracle Diagnostics Pack. Be also aware some scripts also use functionality covered under the Oracle Tuning Pack. And as with any other script you download from the internet, please read-proof it entirely and validate its proper use on your site.
Hope you get to enjoy the “CS Scripts” Tool Set!
Why do you need to gather CBO Statistics?
As I help a peer with a SQL Tuning engagement, I face the frequent case of: “We do not want to gather CBO schema object statistics because we don’t want our Execution Plans to change”. Well, the bad news is that: not gathering stats only gives you a false sense of safety because your Execution Plans can change anyways. The reason has to do with Predicates referencing values out of range. Typical cases include range of dates, or columns seeded with values out of a sequence (surrogate keys). Most applications use them both. Example: predicate that references last X days of data. Imagine that date column on this predicate actually has statistics with low and high value that are outdated, lets say the high value refers to last time we gather stats (several months old). In such cases, the CBO uses some heuristics starting on 10g, where the cardinality of the Predicate is computed according to range of low/high and how far the value on Predicate is from this low/high range as per the stats. In short, the cardinality changes over time, as the Predicate on the last X days of data changes from one day to the next, and the next, and so on. At some point, the CBO may decide for a different Plan (with lower cost) and the performance of such SQL may indeed change abruptly. Then we scratch our heads and repeat to ourselves: but we did not gather statistics, why did the plan change?
So, if you understand the rationale above, then you would agree with the fact that: not updating CBO schema stats do not offer any real Plan Stability. So, my recommendation is simple: have reasonable CBO statistics and live with the possibility that some Plans will change (they would change anyways, even if you do not gather stats). Keep always in mind this:
The CBO has better chances to produce optimal Plans if we provide reasonable CBO statistics.
Now the good news: if you have some business critical SQL statements and you want them to have stable Plans, then Oracle already provides SQL Plan Management, which is designed exactly for Plan Stability. So, instead of gambling everyday, hoping for your Plans not to change preserving outdated stats, rather face reality, then gather stats, and create SQL Plan Baselines in those few SQL statements that may prove to have an otherwise unstable Plan and are indeed critical for your business. On 10g you can use SQL Profiles instead.
On 10g and 11g, just let the automatic job that gathers CBO schema statistics do its part. In most cases, that is good enough. If you have transient data, for example ETL tasks, then you may want to have the process workflow to gather stats on particular Tables as soon as the data is loaded or transformed and before it is consumed. The trick is simple: “have the stats represent the data at all times”. At the same time, there is no need to over do the stats, just care when the change on the data is sensible.
Oracle Queries are taking different Plans
I recently saw a post with this title “Oracle Queries are taking different Plans” and since there was a lot of guessing I suggested to use SQLTXPLAIN and find there the root cause. For some reason or another the thread is still open after 20 days, and the guessing continues. Since the problem of “finding the root cause of a change on an execution plan” is old and still common, I decided to talk about it here.
In Oracle, execution plans do change for one SQL over time, that is a fundamental function of the Cost-based Optimizer (CBO). Not only is normal, but expected and desired in most circumstances. What is not desired, is when a SQL that had a good performing plan suddenly changes its plan to one that we consider sub-optimal in terms of performance. This should be the concern and focus. So WHY the CBO suddenly generates such a plan? The possible reasons are many but I enlist here the most common ones I can think of:
- Schema object statistics changes
- Small sample sizes when gathering CBO schema statistics (mostly on 10g)
- Lack of statistics in some columns referenced by predicates
- Inconsistent values of bind variables referenced by SQL
- System wide changes like CBO parameters or system statistics
- Index modifications including new and dropped indexes
- Invalid or invisible indexes
- Large SQL text with many predicates where several plans with similar cost are possible
- Inconsistent ramp-up process of Adaptive Cursor Sharing (ACS)
- SQL Profiles generated by the SQL Tuning Advisor (STA)
- An index changing its blevel (for example from blevel 2 to 3)
- Volatile values in some columns (for example value “Pending” exists in table column for a short time)
- Asynchronous gathering of stats on volatile data instead of gathering right between load and consumption
The list above is not comprehensive. It only includes what came to my mind while writing it, so I may have forgotten several cases. And of course there are always some corner cases like special conditions activating uncommon heuristics, or simply hitting a CBO bug.
Guessing WHY a plan has changed is very time consuming and requires multiple queries to the metadata on the database. Since most of the metadata we are interested on is dynamic by nature, we base our guess work on an ever changing environment. Of course the root cause become elusive and we may give up for some time, or jump to false conclusions.
This is where SQLTXPLAIN (MOS 215187.1) or its younger and lighter sister SQLHC (MOS 1366133.1) come to the rescue. These free tools, specially SQLTXPLAIN (SQLT), capture the static and dynamic environment around the one SQL we want to analyze.
By having a consistent view of all elements affecting the execution plan, it becomes much easier to find the root cause of a plan change. And since SQLT also includes current and past details about parameters, statistics and bind variable values, we can even correlate those values to prior execution plans. So I encourage you to try SQLTXPLAIN on a SQL next time you are confronted by the old question: “WHY Oracle Queries are taking different Plans?”.
I am aware SQLTXPLAIN is intimidating. Its output is exuberant, but the point is that it includes what we need to find the root cause of most if not all SQL Tuning cases where a plan has changed.
I have presented this SQLT tool in several conferences during the past year or so. I think it is appropriate now to put together a 3 days workshop to master this tool… Just an idea at this time.
