Archive for April 2013
Differences between TKPROF and Trace Analyzer TRCANLZR (TRCA)
When an Oracle user process performs poorly, meaning slower that business requirements, the most common way to start its diagnostics is by turning SQL Trace on, then proceed to review the trace file that is created. This process is usually referred as “tracing” and can be accomplished by several methods including DBMS_MONITOR and ALTER SESSION commands.
Back to the question that motivated this Blog entry: What is the difference between TKPROF and Trace Analyzer? Both input a trace file generated by SQL Trace (also known as EVENT 10046) and both produce a summary out of the input trace.
TKPROF
It has been around since early releases of Oracle. It is included as part of the database software. It is fast. It produces an output report in plain text format. It performs number crunching in memory. It does not have to connect to a database (it can if you want to include Explain Plans in its report). It provides a nice and clean summary of performance metrics for each SQL statement included in trace file.
Trace Analyzer TRCANLZR (TRCA)
It is an add-on tool and not part of the Oracle database product. It is free to download and use out of My Oracle Support (MOS), previously known as Metalink (under note 224270.1). It takes longer to execute than TKPROF. It provides more diagnostics details than TKPROF. It connects to a database (same where the trace was produced or some other). Relies on a database to store the parsed trace, which can help if you want to do some data mining in the contents of the trace. Its output is HTML and also text. It is easier to read than TKPROF specially regarding the Execution Plan. Bottom-line: it is like TKPROF on steroids, as per Eddie Awad’s Blog. See sample below:

Conclusions
Both TKPROF and TRCA are great tools. Keep in mind that there are also some excellent tools external to Oracle in this area. If you need more advanced functionality than the one provided by TKPROF or TRCA, I encourage you to explore these external tools. Personally, I have evaluated Method R and I liked it very much. Also, if you want to learn more about the contents of a SQL Trace you may be interested on this book: Optimizing Oracle Performance by Cary Millsap and Jeff Holt, published by O’Reilly Media.
SQLT XTRACT Report – Sample
In case you have never seen one, you can browse this SQLT XTRACT Report. This sample is a PDF file. The actual report is generated as HTML, which eases the navigation on it.
Monitoring a SQL that executes well thousands of times but sometimes it takes longer
Problem Description
There is this SQL that is constantly executed by many users. This SQL executes in a subsecond thousands of times per day. Every once in a while the same SQL takes several seconds but these incidents are uncommon. Tracing would cause significant overhead since there is no known way to predict when an execution may take longer. In this scenario the concern is finding the root cause of these elusive spikes in the performance of this SQL.
Strategy
Use SQL Monitor report to watch for any SQL that takes longer than a few seconds. Then produce a comprehensive report that would bring some initial light to these spikes. The challenge is to capture this information 24×7 without imposing a significan overhead.
Solution
Implement a script that loops over SQL Monitor views and capture any SQL that took or is taking more than a few seconds. Then review these reports searching by sql_text.
Steps
1. Open a new session and execute mon_repository.sql followed by mon_capture.sql. The latter will loop indefinitely.
2. On a second session execute mon_reports.sql every so often.
3. Review table v_sql_monitor by sql_text then read corresponding report on zip.
Scripts
mon_repository.sql
REM $Header: mon_repository.sql 11.4.5.7.1 2013/04/24 carlos.sierra $

DROP TABLE v_sql_monitor;

CREATE TABLE v_sql_monitor (
 sql_id VARCHAR2(13),
 key NUMBER,
 sql_exec_start DATE,
 sql_exec_id NUMBER,
 status VARCHAR2(19),
 first_refresh_time DATE,
 last_refresh_time DATE,
 username VARCHAR2(30),
 capture_date DATE,
 report_date DATE,
 sql_text VARCHAR2(2000),
 mon_report CLOB,
PRIMARY KEY (sql_id, key));
mon_capture.sql
REM $Header: mon_capture.sql 11.4.5.7.1 2013/04/24 carlos.sierra $
DECLARE
 l_mon_report CLOB;
BEGIN
 LOOP
 INSERT INTO v_sql_monitor (sql_id, key, sql_exec_start, sql_exec_id, status, first_refresh_time, last_refresh_time, sql_text, username )
 SELECT v.sql_id, v.key, v.sql_exec_start, v.sql_exec_id, v.status, v.first_refresh_time, v.last_refresh_time, v.sql_text, v.username
 FROM v$sql_monitor v
 WHERE v.process_name = 'ora'
 AND v.sql_text IS NOT NULL
 AND UPPER(v.sql_text) NOT LIKE 'BEGIN%'
 AND UPPER(v.sql_text) NOT LIKE 'DECLARE%'
 AND (v.status LIKE 'DONE%' OR (v.status = 'EXECUTING' AND (v.last_refresh_time - v.first_refresh_time) > 1/24/60 /* 1 min */))
 AND NOT EXISTS (SELECT NULL FROM v_sql_monitor t WHERE t.sql_id = v.sql_id AND t.key = v.key);

FOR i IN (SELECT t.*, t.ROWID row_id FROM v_sql_monitor t WHERE t.capture_date IS NULL)
 LOOP
 l_mon_report := DBMS_SQLTUNE.REPORT_SQL_MONITOR (
 sql_id => i.sql_id,
 sql_exec_start => i.sql_exec_start,
 sql_exec_id => i.sql_exec_id,
 report_level => 'ALL',
 type => 'ACTIVE' );

UPDATE v_sql_monitor
 SET mon_report = l_mon_report,
 capture_date = SYSDATE
 WHERE ROWID = i.row_id;
 END LOOP;

COMMIT;

DBMS_LOCK.SLEEP(60); -- sleep 1 min
 END LOOP;
END;
/
mon_reports.sql
REM $Header: mon_reports.sql 11.4.5.7.1 2013/04/24 carlos.sierra $
SET ECHO OFF FEED OFF VER OFF SHOW OFF HEA OFF LIN 2000 NUM 20 NEWP NONE PAGES 0 LONG 2000000 LONGC 2000 SQLC MIX TAB ON TRIMS ON TI OFF TIMI OFF ARRAY 100 NUMF "" SQLP SQL> SUF sql BLO . RECSEP OFF APPI OFF AUTOT OFF SERVEROUT ON SIZE UNL;

SPO reports_driver.sql;
PRO SET ECHO OFF FEED OFF VER OFF SHOW OFF HEA OFF LIN 2000 NUM 20 NEWP NONE PAGES 0 LONG 2000000 LONGC 2000 SQLC MIX TAB ON TRIMS ON TI OFF TIMI OFF ARRAY 100 NUMF "" SQLP SQL> SUF sql BLO . RECSEP OFF APPI OFF AUTOT OFF SERVEROUT ON SIZE UNL;;
BEGIN
 FOR i IN (SELECT t.sql_id, t.key, t.ROWID row_id FROM v_sql_monitor t WHERE t.report_date IS NULL)
 LOOP
 DBMS_OUTPUT.PUT_LINE('SPO sql_id_'||i.sql_id||'_key_'||i.key||'.html;');
 DBMS_OUTPUT.PUT_LINE('SELECT mon_report FROM v_sql_monitor WHERE sql_id = '''||i.sql_id||''' AND key = '||i.key||';');
 DBMS_OUTPUT.PUT_LINE('SPO OFF;');
 DBMS_OUTPUT.PUT_LINE('UPDATE v_sql_monitor SET report_date = SYSDATE WHERE ROWID = '''||i.row_id||''';');
 DBMS_OUTPUT.PUT_LINE('HOS zip -m mon_reports sql_id_'||i.sql_id||'_key_'||i.key||'.html');
 END LOOP;
END;
/
PRO COMMIT;;
PRO SET TERM ON ECHO OFF FEED 6 VER ON SHOW OFF HEA ON LIN 80 NUM 10 NEWP 1 PAGES 14 LONG 80 LONGC 80 SQLC MIX TAB ON TRIMS OFF TI OFF TIMI OFF ARRAY 15 NUMF "" SQLP SQL> SUF sql BLO . RECSEP WR APPI OFF SERVEROUT OFF AUTOT OFF;;
SPO OFF;

@reports_driver.sql

HOS zip -m mon_reports reports_driver.sql
HOS unzip -l mon_reports

SET TERM ON ECHO OFF FEED 6 VER ON SHOW OFF HEA ON LIN 80 NUM 10 NEWP 1 PAGES 14 LONG 80 LONGC 80 SQLC MIX TAB ON TRIMS OFF TI OFF TIMI OFF ARRAY 15 NUMF "" SQLP SQL> SUF sql BLO . RECSEP WR APPI OFF SERVEROUT OFF AUTOT OFF;
WHY SQLT XTRACT produces two EVENT 10053 traces?
If you use SQLT XTRACT often, you may have noticed that in some cases the sqlt_sNNNNN_*.zip file contains two 10053 traces instead of one. The question is WHY?
Take for example this:
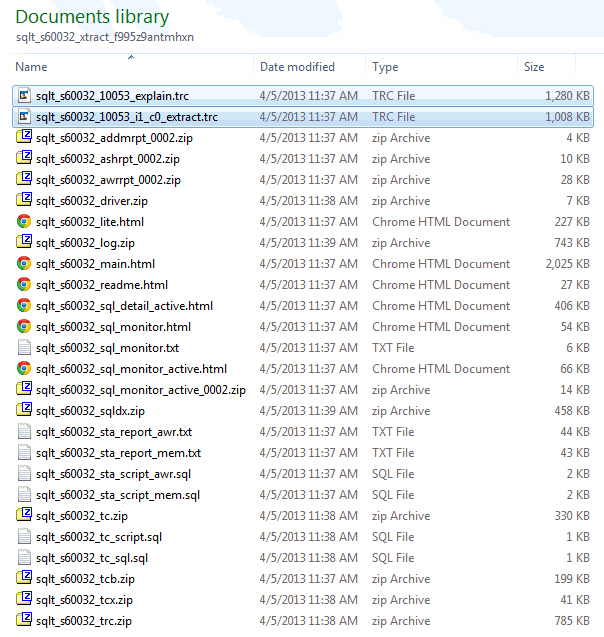
The first file reads “explain” and it is generated by enabling EVENT 10053 during an EXPLAIN PLAN FOR command on the SQL Text associated to the SQL_ID passed to SQLT XTRACT. So this 10053 may not be accurate if the SQL has binds and bind peeking is enabled.
The second file reads “i1_c0_extract’. The “i1” part means instance 1 and the “c0” means child cursor zero. This 10053 is generated by API SYS.DBMS_SQLDIAG.DUMP_TRACE which is available on 11.2 and higher.
When I see both files I usually focus on the one from the new API, since the “explain” may show a different plan than the one actually executed. In any case, look first at the Plans Summary section of SQLT main report and pay attention to the plan hash values. Then on your 10053 search for Plan Table and compare the hash value with the one from SQLT main report.
Understanding SQLTXPLAIN Health-Checks
SQLTXPLAIN (SQLT) collects diagnostics details about a SQL statement that either performs poorly or it produces unexpected results (also known as wrong results). In addition to that, it also performs over a hundred health-checks around the SQL statement being analyzed. The results of these so called health-checks are displayed on the main HTML report under the “Observations” section. Within each observation there is description of the meaning and in some cases a pointer to known bugs or notes. Since there are so many health-checks, it happens that every once in a while we want to dig further into WHY we get this “observation”. If that is your case and you understand SQL and PL/SQL, I invite you to “hack” into the SQLT source code and see how this health-check is triggered.
Finding WHY SQLT triggered a particular Health-Check
Assume you get this “observation” in your main HTML report “Table contains 2 column(s) referenced in predicates where the number of distinct values does not match the number of buckets.“.
Open sqlt/install/sqcpkgh.pkb (this h is for health-checks) and search for a portion of this text “number of distinct values does not match the number of buckets”. You will find a piece of code that looks like this:
 -- 10174050 frequency histograms with less buckets than ndv
 BEGIN
 SELECT COUNT(*)
 INTO l_count
 FROM sqlt$_dba_all_table_cols_v
 WHERE statement_id = p_tab_rec.statement_id
 AND owner = p_tab_rec.owner
 AND table_name = p_tab_rec.table_name
 AND histogram = 'FREQUENCY'
 AND num_distinct <> num_buckets
 AND in_predicates = 'TRUE';

IF l_count > 0 THEN
 s_obs_rec.type_id := E_TABLE;
 s_obs_rec.object_type := 'TABLE';
 s_obs_rec.object_name := p_tab_rec.owner||'.'||p_tab_rec.table_name;
 s_obs_rec.observation := 'Table contains '||l_count||' column(s) referenced in predicates where the number of distinct values does not match the number of buckets.';
 s_obs_rec.more := 'Review <a href="#tab_cols_cbo_'||p_tab_rec.object_id||'">column statistics</a> for this table and look for "Num Distinct" and "Num Buckets". If there are values missing from the frequency histogram you may have Bug 10174050. If you are referencing in your predicates one of the missing values the CBO can over estimate table cardinality, and this may produce a sub-optimal plan. As a workaround: alter system/session "_fix_control"=''5483301:off'';';
 ins_obs;
 END IF;
 END;
In this case the health-check derives from view sqlt$_dba_all_table_cols_v. You can find all view definitions inside file sqlt/install/sqcvw.sql. This file shows that view sqlt$_dba_all_table_cols_v selects from tables sqlt$_dba_tab_cols and sqlt$_dba_nested_table_cols.
There is a predicate on the health-check that reads “num_distinct <> num_buckets“. So this condition is what triggered this particular health-check.
In some cases, the column driving the health-check is an addition to the base DBA or GV$ views, so in such cases you may have to search for that column in one of these two packages: sqlt/install/sqcpkgd.pkb or sqlt/install/sqcpkgt.pkb. Where the “d” stands for Diagnostics data collection and the “t” for Transformation of diagnostics data.
Conclusion
When you get a SQLT health-check that is of your concern and you need to find out WHY it was raised, you may need to look into SQLT source code. Always start on the “h” module and continue either in view definitions or in the two packages that seed special columns. Those two packages “d” and “t” are the ones responsible for data collection and transformations.
SQLT source code is transparent. It is written in an easy to follow style. Feel free to reverse engineer any part of it. No mysteries, no hidden pieces, no black magic…
How SQLTXPLAIN became to be…
For those of you who like stories, this is the story about “how SQLTXPLAIN became to be“. I wrote it as a foreword for Stelios Charalambides book on SQLTXPLAIN. If you want to learn more about SQLTXPLAIN you may want to consider reading Stelios book.
*****************************************************
Foreword by Carlos Sierra – author of the SQLTXPLAIN tool.
You are about to read this book on the subject of SQL Tuning using SQLTXPLAIN (also referred to as SQLT for short). Chances are you know a bit about what this SQLT tool offers but not much about the story behind it. This foreword provides some background on how this tool became what it is today. I hope you enjoy this behind-the-scenes look at the motivations and events that slowly came together over the years as I’ve worked on the tool you’re about to learn.
In the late 1990s I was a “road warrior” like many consultants back then. I was an Oracle “field support engineer” with pretty good expertise in manufacturing and SQL tuning, and I had chosen to be part of the Short-term Assignments Team. (We had two options back then, short or long-term assignments!). I used to travel a lot from site to site for these assignments.
Manufacturing and SQL Tuning was a good combination for someone like me, willing to go on site and handle some of the big fires affecting large manufacturing corporations using Oracle ERP. Life was intense, and it was good! After several week-long assignments I started noticing some patterns: when trying to diagnose a SQL statement performing poorly, there were many areas to look at, and trace/tkprof would not give me everything I needed to effectively diagnose SQL tuning issues promptly! Through my assignments, I developed a set of flexible scripts. That is how the legendary coe_xplain.sql came to life.
Karl Daday, my manager at the time, supported my endeavors and actually encouraged me to build my own set of tools so I could deliver results in a one-week time frame. Thus, I used coe_xplain.sql on pretty much every performance assignment and always with good results. Over time I was glad I developed this little tool, since most of my enhancement requests for tkprof are still pending.
One day, while I has happily using my coe_xplain.sql personal script, as well as some other scripts I had developed, a talented DBA in one of the corporations I was working with at the time asked me if he could keep my set of tools for later use. My concern over leaving behind my toys was that I knew from experience that anything you code will follow you your entire life, which is both a reward and a curse. If your code has only a few bugs, you do fine. Otherwise, you feel haunted and hunted for decades!
Nevertheless, I decided to share my coe_xplain.sql and other small tools, with the understanding that their users would take them “as is.” A year later, the same DBA asked me if I would publish my coe_xplain.sql script in Metalink (now known as MyOracle Support), so he could keep getting new versions if I decided to keep it updated. This was a turning point for me. Making a tool available in Metalink back in 2001 meant only one thing to me: I was willing to compromise to keep this tool free of bugs as much as possible, and I would have to react to enhancement requests even if that meant declining them all. I knew back then (as I know today) that I always have a hard time saying “no” when I actually can and want to say “yes.” So after coe_xplain.sql was published in Metalink, I quickly started getting some questions like: “Can you add this little tiny functionality to your otherwise nice script?”
Late in 2002 the coe_xplain.sql script had become a large script, and I decided it was time to actually upgrade it to PL/SQL. That would mean rewriting the entire functionality but using one PL/SQL package instead of several SQL statements embedded into one large script. In those days I was still part of a team named the “Center of Expertise.” That is why coe_xplain.sql had that prefix “coe_”. Today there are many teams within Oracle sharing the same “CoE” name, so I feel its meaning is somewhat diluted. (Something similar happened to the “BDE” team, which means “Bug Diagnostics and Escalations.” That’s the reason why some of my scripts had and still have the prefix “bde_”.)
I decided it was time to upgrade coe_xplain.sql to something more robust. I no longer wanted to name my scripts after the name of the team I was working for. So in 2002, on the second major version, this coe_xplain.sql tool came to be SQLTXPLAIN, and I published it on Metalink (MyOracle Support) under note 215187.1, which still is its location today. The name SQLTXPLAIN is loosely derived from “SQL Tuning and Explain Plan”. I had searched the Internet and had not found any references to this SQLTXPLAIN name. I was trying to avoid collisions with other tool names, products, or companies, and as of today I have succeeded, at least in regard to this naming!
SQLTXPLAIN was rapidly adopted by many Oracle ERP teams within Oracle Support and gradually through Oracle Development. Most of the SQLT enhancement requests I used to get in those days were E-Business Suite (EBS) specific, so SQLTXPLAIN became mostly a tool to diagnose SQL statements performing poorly within EBS. From 2002 all the way to 2006, this tool was installed inside the application schema, what was APPS for EBS. So SQLTXPLAIN used to have strong EBS dependencies. It was created inside an application schema, creating and dropping objects there. But don’t panic! It no longer works like this.
Those years between 2002 and 2006 were difficult for me at Oracle. I was extremely busy developing internal applications. I was also getting my master’s degree in computer science, so I had a double challenge on my hands. And that’s not to mention that my wife and I were raising four teenagers! Thus, SQLTXPLAIN was practically frozen until 2007.
I didn’t mention it before, so I will now: SQLTXPLAIN was never an official project with Oracle. SQLTXPLAIN up until 2007 was my weekend pet project (a big one!). I spent pretty much all my personal free time developing and maintaining this tool. It was my baby and still is today. I am very lucky that my wife Kelly Santana, who also works for Oracle, has been so very supportive during all these busy years. Without her patience and understanding I would have had to abandon SQLTXPLAIN and taken it off Metalink years ago!
Late in 2006 I moved to the Server Technologies Center of Expertise (ST CoE) within Oracle. I had been at the Applications CoE before, and now I was getting into the ST CoE. That was “the other side of the house,” “the dark side” as some call it, or simply “the other side.” I took with me all my EBS expertise and all my tools. Steve Franchi, one of the best managers I have had at Oracle, gave me the green light to keep maintaining my tools, so I was going to be able to work on SQLTXPLAIN during my regular working hours. That was a huge incentive for me, so I was very happy at my new home within Oracle. Until then, most of my scripts were actually worked only at night and on the weekend. That’s the problem when your hobby and your job blend so smoothly into one: and on top of that, you have the privilege of working from home. So today I would say I take care of SQLTXPLAIN pretty much around the clock, every day of the week. But of course I still sleep and eat!
Once I joined the ST CoE, I was on a mission of my own: I wanted the Server Technologies Support group to get to know SQLTXPLAIN and actually adopt it as much as EBS, so I requested a meeting with one of the legends and leaders at the performance support team. This is how I got to meet Abel Macias. When I asked Abel about using SQLTXPLAIN for ST performance issues, his answer was brusque. I don’t recall his exact words, but the meaning was something like this: “We won’t use it, because it sucks big time.”
Abel is known for his sometimes no-nonsense (but correct) answers. He is a very humble human being, and is way too direct in his observations, which can be intimidating. After my initial shock, I asked him why he thought that way. This opened the door to a short but significant list of deficiencies SQLTXPLAIN had. I walked away demoralized but with a new challenge in front of me: I would take all that constructive criticism and turn it around into big enhancements to SQLTXPLAIN. After several weeks of hard work (and way too many cups of coffee), I met Abel again and showed to him all those “adjustments” to SQLTXPLAIN. Then and only then did he like it, and Abel and I became friends! Today, we ride our bikes together for miles. And even if we don’t want to, we frequently have short but meaningful conversations on SQL Tuning and SQLTXPLAIN while we enjoy our trail rides, or while having a beer… or two.
With Abel’s input, SQLT became application independent, installed in its own schema, and RAC aware. Since the name SQLTXPLAIN was so unique, it became the name of the application schema into which all the tool objects would be installed. Everything looked fine, but there was something bothering me, and it was the fact that SQLTXPLAIN had been heavily modified and was requiring more and more maintenance. It was time for a third full rewrite. Since the code was already big, I knew I would need a lot of dedicated time with no interruptions at all. I decided to take advantage of all my accumulated vacation time, together with a few holidays; and during December 2009 and January 2010 I pretty much lived in my man-cave developing thethird major version of SQLT.
I finished with all the details and testing on April 2010. SQLT now had several packages, and it was getting close to 100,000 lines of code, all developed with two fingers (I still type with two fingers). Some people think SQLT is developed and maintained by a large team. Sorry to disappoint you if you think this way: SQLT was conceived as a tool for someone from support to make his/her life easier and is now somehow shared and used by many others working on the complex task of SQL Tuning. Still the spirit of this tool remains unchanged: a tool to help to diagnose a SQL statement that performs poorly (or which generates wrong results).
SQLTXPLAIN, on its third major version from April 2010, was rapidly adopted by the Server Technologies performance team within support. Since I joined the ST CoE I also have had the pleasure to develop two internal one-week SQL Tuning workshops. After delivering them dozens of times to more than 700 Oracle professionals around the world, I have collected and incorporated hundreds of enhancements to SQLT that were communicated verbally during class.
From all the good and smart people providing me with ideas on how to enhance SQLT, I want to mention two by name, who in addition to Abel have made exceptional contributions to the feature set of the tool: Mauro Pagano and Mark Jefferys. Mauro, with his constant insight, inspired SQLTXPLAIN’s XPLORE method, which uses brute force analysis to narrow possible culprits of a regression after an upgrade. Mark, with his strong math and science background, showed me several mistakes I had made, especially around statistics and test case creation. With all sincerity, I think SQLT is what it is today thanks to all the constructive feedback I constantly get from very smart people. Sometimes the feedback is brutal, but for the most part it is just asking me to incorporate a thing here or there, or to fix a small bug. As enhancement examples I would mention some big ones: adding Siebel and PeopleSoft awareness in SQLT, and all the health-checks it performs.
I consider myself a very lucky guy to have had the opportunity to work for such a great company as Oracle since 1996; I have also had some great managers who have been very supportive in taking what I believe is the right approach to diagnose difficult SQL Tuning issues. I do not regret a single minute of my personal time that I have dedicated to this SQLTXPLAIN tool. At the beginning it was from me and to me. Now it is from me and many other bright minds to basically anybody who wants to get his/her hands into some serious SQL Tuning in an Oracle database.
When Stelios Charlambides asked my opinion about him writing a book in which SQLXPLAIN was a central part, I felt honored and happy. Many people have asked me: “When can we have a book on SQLTXPLAIN?” If you are one of those people, please enjoy what Stelios has developed during his own personal time, and thank him for this book! I truly hope you get to enjoy SQLTXPLAIN and even SQL Tuning.
I always say that SQL Tuning is like sushi, you either love it or you hate it! I hope that as you get to learn more, you’ll fall in love with it as I did back in the 1990s. Also keep in mind that with SQL Tuning you never finish learning. Good foundations, curiosity, perseverance, and experience—these are just some of the ingredients to one day feeling comfortable doing SQL Tuning. Cheers!
A couple of new cool Blogs in the area of Oracle Performance!
Abel Macias and Stelios Charalambides are now blogging! Abel is one of those truly gurus in the area of Oracle performance (both server and SQL Tuning) and Stelios is well versed in Oracle performance and Oracle in general. Both work for Oracle helping out in the Exadata team. And both know SQLTXPLAIN in and out. Abel has been a key contributor in the creation of SQLTXPLAIN and Stelios has written a book on SQLTXPLAIN. Please take some time to browse their new blogs. You may want to bookmark them or subscribe for future references. Please join me to welcome both! I am so happy to see more Oracle professionals opening up to share their treasured knowledge through some blog of their own!
A couple of myths about Plan Stability and CBO Statistics
Every so often I get asked about this two statements:
- Bind Peeking requires Histograms in order to generate multiple Execution Plans.
- Freezing CBO Statistics freezes an Execution Plan.
Both are myths. The true is that you don’t have to have Histograms for a Plan using Bind Peeking to change. And even if you freeze your CBO Statistics your Plan may change.
Range Predicates and Bind Peeking
Consider Range Predicate “COLUMN > :b1“. Where column low/high values are “A” and “Z”. If value of bind :b1 is “A” at the time of a hard parse, the Selectivity of this Predicate is close to 1. If the CBO peeks the value of “Z” the Selectivity is close to zero. A variation of Selectivity like this may change an Execution Plan. Thus: “COLUMN does not require to have a CBO Histogram for Bind Peeking to produce multiple Execution Plans”.
Frozen CBO Statistics and Plan Stability
If your table contains columns based on sequences (like in a Primary Key), or if it contains DATE type columns, your Execution Plan may change even if the CBO Statistics do not change.
- Consider Predicate “N1 = :b1” where N1 is a NUMBER type column based on a sequence with 100 distinct values and low/high values of 1 and 100. Then hard parse this SQL with values of 100 and 200. The first value may result in a Selectivity of 0.01 while the second my be close to zero. That is a significant change that may cause a plan to change.
- Consider Predicate “D1 = :b2” where D1 is a DATE type column with 100 distinct values and low/high of 2013/01/01 and 2013/04/17. Then hard parse this SQL with values of 2013/02/14 and 2013/12/31. Same as the prior case, one value may render a selectivity close to 0.01 while the other close to zero.
The question in both cases above is: WHY would I pass a value out of range? As time progresses, users tend to pass more recent values and since CBO Statistics are frozen, these peeked values become out of low/high range and departing from their low/high end over time. Thus, the Predicate Selectivity diminishes gradually over time. At some point your otherwise stable Execution Plan may suddenly change. Thus: “Freezing CBO Statistics does not freeze Execution Plans”.
Conclusion
Since lack of Histograms or freezing CBO Statistics do not guarantee Plan Stability, do not rely on these two myths. If what you are looking for is Plan Stability use then SQL Plan Management available since 11g or SQL Profiles available from 10g.
IOUG COLLABORATE 13
I will be speaking at the Independent Oracle Users Group (IOUG) “COLLABORATE 13” conference next week (April 8-11, 2013). I will deliver two sessions:
- SQL Tuning made easier with SQLTXPLAIN (SQLT): Monday, April 8 between 3:45 and 4:45 pm. Mile High Ballroom 3A.
- How to improve SQL Performance with new SQL Health Check Tool: Wednesday, April 10 between 1:00 and 2:00 pm. Mile High Ballroom 3A.
This time I will demo SQLT installation and use of the SQLT XTRACT method. For the SQLHC I will demo an actual execution. So, I will spend less time in PPTs and more time showing how to use these tools and how to navigate their output. Feedback from prior events ask for more demo time…
Traveling to Denver in 3 hours (Saturday morning) and returning home (Orlando) on Thursday night. If you are attending this IOUG COLLABORATE 13 event I would love to meet you!
Also, if you have ANY questions about SQLTXPLAIN (SQLT) or SQL Health-Check (SQLHC) keep in mind I am just one email away!
Fixing ORA-19384 from DBMS_SQLTUNE.PACK_STGTAB_SQLSET on SQLT
If you see in the main html SQLTXPLAIN (SQLT) the following error you can execute the commands below connected as SYS:
sqlt$a: *** d:ORA-19384: cannot pack into staging table from previous version
sqlt$a: *** d:DBMS_SQLTUNE.PACK_STGTAB_SQLSET
DROP TABLE sqltxplain.sqli$_stgtab_sqlset;
BEGIN
 SYS.DBMS_SQLTUNE.CREATE_STGTAB_SQLSET (
 table_name => 'SQLI$_STGTAB_SQLSET',
 schema_name => 'SQLTXPLAIN');
END;
/
DROP TABLE sqltxplain.sqlt$_stgtab_sqlset;
BEGIN
 SYS.DBMS_SQLTUNE.CREATE_STGTAB_SQLSET (
 table_name => 'SQLT$_STGTAB_SQLSET',
 schema_name => 'SQLTXPLAIN');
END;
/
